
COMM 214 Business Analytics is the 3-credit statistics course in the John Molson School of Business core at Concordia University. In Section EC for Fall 2026, the cumulative in-person final is worth 55% of the grade, and you must score at least 50% on it to receive credit, whatever your other marks are.
Note on the code: this guide describes the Concordia course, written "COMM 214" in the Concordia calendar. Other institutions use COMM214 for unrelated subjects, so check the title on your own enrolment. MAAS is an independent academic support provider with no affiliation to Concordia University.
Author: MAAS Editorial Team
Last updated: 2026-10-09
Category: business-management
What is COMM 214 about, and who has to take it?
Direct answer: COMM 214 teaches statistics as a tool for business decisions: describing data, probability, sampling, estimation, hypothesis testing and regression, plus a short introduction to big data. It sits in the JMSB core, so students in both the BComm and the BAdmin take it whatever their major.
Evidence: Section 61.22 of the Concordia Undergraduate Calendar describes a 48-credit JMSB core, of which 34.5 credits are at the 200 level, and lists COMM 214 Business Analytics at 3.00 credits next to COMM 213 Computing and Visualization Tools for Business Analytics at 1.50. The prerequisites are MATH 208 and MATH 209 completed beforehand, with COMM 213 completed beforehand or at the same time. Students who already have credit for COMM 215, BIOL 322, ECON 222, GEOG 362, MAST 333, PSYC 316, SOCI 213 or STAT 360 cannot take it for credit.
Example: A marketing major who sees "analytics" in the title often expects dashboards. The Fall 2026 outline instead lists six learning objectives that start with data collection and measurement types and end with regression and big data, and the textbook chapters are Business Statistics and Analytics in Practice (Bowerman et al., 2025). Treat it as a statistics course with software, not a software course with statistics.
How is COMM 214 graded in Fall 2026?
Direct answer: Section EC has five components: quizzes (best 3 of 5) worth 8%, an online midterm worth 22%, Connect study activities (best 3 of 5) worth 8%, a team Data Analysis Project worth 7%, and a cumulative in-person final worth 55%. The exams together carry 77% of the grade.
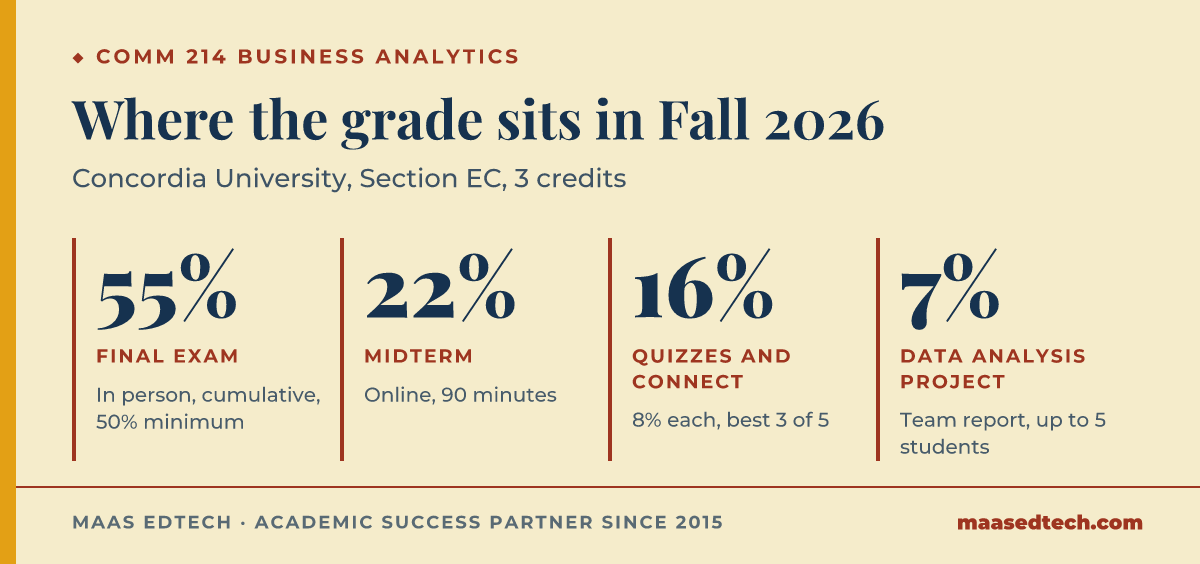
Evidence: The weightings below come from the eConcordia outline for Section EC, Fall 2026. The same document warns that "the content and/or evaluation scheme in this course is subject to change", and other sections publish their own outlines, so the course site for your own section is the final word.
| Component | Weight | Format stated in the outline | Rule that matters |
|---|---|---|---|
| 5 online quizzes, best 3 count | 8% | Multiple choice and numerical word problems, one sitting on Connect | No replacement quiz, whatever the reason |
| Midterm exam, 24 October 2026 | 22% | Online, 90 minutes, 10:30 to 12:00, chapters 1 to 4 and 6 to 7 | Alternate on 25 October only with a documented medical or religious reason |
| 5 Connect study activities, best 3 count | 8% | Three attempts per exercise, score based on the best two | No extension, because the two worst are dropped |
| Data Analysis Project (DAP) | 7% | Teams of at most 5, Excel or Minitab, report due 7 December at 23:59 | Team formation opens in week 4 |
| Final exam, 9 to 22 December period | 55% | In person, cumulative, multiple choice and word problems | At least 50% required to receive credit |
Example: The midterm and the final together carry 77% of the course, and the grading scale is generous at the bottom and strict at the gate. A D- starts at 50%, an A starts at 85% and an A+ at 90%. Because the 45% outside the final can add up to a comfortable cushion, a student who has banked most of it can still fail the course by scoring 49% on the final. Passing the final is a separate requirement, not an average.
How do you lock in the basics early?
Direct answer: Work through chapters 1 to 4 in the first three weeks and attempt each Connect study activity before its quiz. The outline schedules Connect 1 on 26 September and Quiz 1 on 27 September, which cover chapters 1 to 3, so the first graded work arrives after only three weeks of classes.
Evidence: The agenda moves quickly. Connect 1 is due on 26 September and Quiz 1 opens on 27 September. Week 1 is the introduction in chapter 1, week 2 covers descriptive statistics in chapters 2 and 3, and week 3 starts probability in chapter 4. Quiz 2 on 11 October covers chapters 4, 6 and 7, so probability models and the discrete and continuous distributions are tested before the midterm. Dunlosky et al. (2013), reviewing 10 learning techniques, rated practice testing and distributed practice as the two with high utility, which fits a course where five Connect activities and five quizzes are spread across the term.
Example: Consider the best-3-of-5 rule. Each counted quiz is worth about 2.67% of the course, and each counted Connect activity the same. A student who skips Quiz 1 because the first week felt easy has not lost anything yet, but has spent one of the two free misses, and Quiz 5 on regression is the hardest one to skip because chapters 14 and 15 are tested only there and in the final.
How should you prepare for the midterm?
Direct answer: Prepare for a 90-minute online exam on chapters 1 to 4 and 6 to 7: descriptive statistics, probability, and the binomial, discrete and continuous distributions. Practise under the same time limit, because 22% of the grade is decided in one sitting on 24 October.
Evidence: The outline sets the midterm for Saturday 24 October 2026 from 10:30 to 12:00, online, and the coverage list leaves out sampling distributions (chapter 8) and everything after it. Reading week begins on 10 October and the mid-term break runs from 12 to 16 October, so the revision window falls in the break and in the week after it. Rohrer and Taylor (2007) tested college students on mathematics problems and found that "When tested 1 week later, performance was vastly superior after mixed practice" (Rohrer & Taylor, 2007, p. 481), which supports mixing probability, counting and distribution questions in one session instead of finishing one topic at a time.
Example: A typical trap is a binomial question that looks like a probability question. Chapter 6 lists only sections 6.1 to 6.3, plus the appendix on the binomial distribution, so the course expects you to recognise when a count of successes in a fixed number of trials has the binomial form, and then to use software or the formula correctly. Practise deciding which distribution applies before you calculate anything.
How should you prepare for the final exam?
Direct answer: Start revising for the final by the end of November. It is cumulative, in person, and covers every chapter taught, including hypothesis testing (chapter 10), chi-square tests (chapter 13), simple regression (chapter 14), multiple regression (chapter 15) and the big data supplement.
Evidence: The final carries 55% and the outline calls it "the most appropriate" way to assess the quantitative competencies. The learning objectives table shows the final assessing all six objectives, the same as the Data Analysis Project, while Quiz 5 is the only quiz that covers the regression chapters. The exam period runs from 9 to 22 December, and the exact date, time and room are posted in the Student Hub. The last class is 7 December, which is also the DAP deadline, so the project and the first days of final revision compete for the same week.
Example: Build a one-page decision list instead of a formula list. For each chapter, write the question a business would ask, the test or model that answers it, the condition that must hold, and the sentence that interprets the result. Wasserstein and Lazar (2016) set out the American Statistical Association's warning that a p-value does not measure the probability that a hypothesis is true, and the final's word problems reward that kind of careful reading of results, not only the arithmetic.
What does the Data Analysis Project actually test?
Direct answer: The DAP is a team report, worth 7%, that applies the course methods to a real business data set: choosing the correct model for estimation and testing, analysing the results and presenting them. Teams of at most 5 may use Excel, Excel add-ins or Minitab.
Evidence: Team formation begins in week 4, on the agenda for 28 September to 4 October, and ends in week 7, when access to the assignment opens. The report is due on 7 December at 23:59, the last day of classes. Because the project is assessed against the same learning objectives as the final, it is practice for the exam's interpretation questions, not a separate skill.
Example: The usual weak report shows a correct regression table and then one sentence of commentary. A stronger report states the business question first, checks that the assumptions are plausible, reports the estimate with its uncertainty, and ends with what the business should or should not conclude. A team should agree on this structure before anyone opens the software.
Can you use outside help in COMM 214?
Direct answer: Outside help is acceptable when it teaches you a method, and not acceptable when someone else produces your graded answers. The outline defines plagiarism as presenting another person's work as your own and says that includes work completed by another student or purchased from any source.
Evidence: The quizzes, Connect study activities, midterm and final are individual work, and the final is run by the Examinations Office under Concordia's examination regulations. Only the DAP is a team task, and the whole team is accountable for what it submits. The instructor's materials are also protected: the outline states that online lectures and notes remain the instructor's intellectual property and may not be distributed.
Example: Asking a tutor to explain why a confidence interval narrows when the sample grows is a method question. Sending a tutor the Quiz 3 questions while the quiz window is open is not. If you are unsure which side a request falls on, ask your instructor through the course email before you ask anyone else.
Frequently asked questions
Is COMM 214 a hard course?
The outline describes a broad statistics sequence covering 12 weekly lessons, from descriptive statistics to multiple regression and big data. The difficulty is pace and cumulative content, with 55% of the grade in one final, rather than advanced mathematics beyond MATH 208 and MATH 209.
When is the COMM 214 midterm in Fall 2026?
For Section EC, the midterm is online on 24 October 2026 from 10:30 to 12:00, covering chapters 1 to 4 and 6 to 7. The alternate sitting is on 25 October at 10:30, available only with a documented medical or religious reason.
Do I have to pass the final to pass COMM 214?
Yes. The outline states that to receive credit for the course, a student must score at least 50% on the final examination, which is cumulative and written in person.
What grade counts as an A in COMM 214?
The outline sets A+ at 90% or above, A from 85% to below 90%, and A- from 80% to below 85%. A D- starts at 50%, and anything below 50% is an F.
Which textbook does COMM 214 use?
Section EC uses Bowerman, Drougas, Duckworth, Froelich, Hummel, Moninger and Schur, Business Statistics and Analytics in Practice, 2025 release, a custom McGraw-Hill textbook that includes the Connect platform. Access is included in the course materials fee.
Does MAAS complete COMM 214 quizzes, projects or exams?
No. MAAS mentors explain statistical methods and review your own worked practice problems. Every quiz, Connect activity, project section and exam answer must be yours, in line with the outline's rules on academic integrity.
Related reading
- COMM 305 Managerial Accounting: a second JMSB core course where most of the grade sits in two written exams
- ENGR 391 Numerical Methods in Engineering: another Concordia course graded on midterm and final performance
- COMM1190 Data Insights and Decisions: how correct analysis still loses marks when the business recommendation is missing
- How to revise for final exams effectively: a longer look at spaced and mixed practice before a comprehensive final
Where MAAS fits
- Subject tutoring, one to one: 60 or 90 minute sessions with a tutor matched to statistics or business analytics, working through your own practice problems. Tutoring is advisory, so it carries no grade target; if the tutor is not the right fit, you can ask to change expert
- Exam coaching resources: how MAAS mentors approach preparation for timed exams
References
- Bowerman, B. L., Drougas, A. M., Duckworth, W. M., Froelich, A. G., Hummel, P., Moninger, J. K., & Schur, P. (2025). Business statistics and analytics in practice (2025 release, custom ed.). McGraw-Hill.
- Dunlosky, J., Rawson, K. A., Marsh, E. J., Nathan, M. J., & Willingham, D. T. (2013). Improving students' learning with effective learning techniques: Promising directions from cognitive and educational psychology. Psychological Science in the Public Interest, 14(1), 4–58. https://doi.org/10.1177/1529100612453266
- Rohrer, D., & Taylor, K. (2007). The shuffling of mathematics problems improves learning. Instructional Science, 35(6), 481–498. https://doi.org/10.1007/s11251-007-9015-8
- Wasserstein, R. L., & Lazar, N. A. (2016). The ASA statement on p-values: Context, process, and purpose. The American Statistician, 70(2), 129–133. https://doi.org/10.1080/00031305.2016.1154108
Tools & resources
- Concordia University. (n.d.). Section 61.22 The JMSB core. Undergraduate Calendar. Retrieved October 9, 2026, from https://www.concordia.ca/academics/undergraduate/calendar/current/section-61-john-molson-school-of-business/section-61-22-the-jmsb-core.html
- eConcordia. (2026). COMM 214: Business analytics, Section EC, Fall 2026 [Course outline]. Concordia University. https://www.econcordia.com/home/CourseDetails.aspx?id=5944&semester=121
This article is part of the MAAS Journal series for international students. MAAS is an independent academic support provider. For courses assessed by exams and individual online work, we offer one-to-one tutoring on methods only; we do not write, complete or submit any assessed work.