
◆ Research Methods
What does percentile mean, and how do quartiles work?
A percentile tells you where one score sits among all the scores, by counting how many fall below it. A score at the 70th percentile beats about 70% of the others, which is a different statement from scoring 70%. This guide uses one invented exam of 20 students to explain percentiles, quartiles and the interquartile range, and to show why SPSS, R and Excel can print different quartiles for the same data and what to write in your methods section when they do. If you are still deciding which summary to report, start with mean, median and mode: choosing the right measure.
◆ Question 1 / 9 · Meaning
What is percentile in simple words?
Direct answer: A percentile is a position in a ranked list. It says what share of the scores lie below a given value. Illowsky and Dean (2023) put it plainly: a percentile indicates the relative standing of a data value, and percentiles divide a data set into 100 equal parts.
Imagine ranking every student from lowest to highest mark and then cutting the line into 100 equal slices. The percentile is the slice a student lands in. It is a statement about rank, so it depends on who else sat the exam. The same raw mark can be a high percentile in a hard paper and a modest one in an easy paper. Throughout this guide we use one invented set of 20 exam marks out of 100, listed from lowest to highest: 38, 45, 49, 52, 55, 57, 58, 60, 62, 63, 65, 66, 68, 70, 72, 74, 77, 81, 86 and 98. The mean is 64.8 and the median is 64. These figures are made up for teaching and come from no real cohort.
◆ Question 2 / 9 · 70th percentile
What does 70 percentile mean?
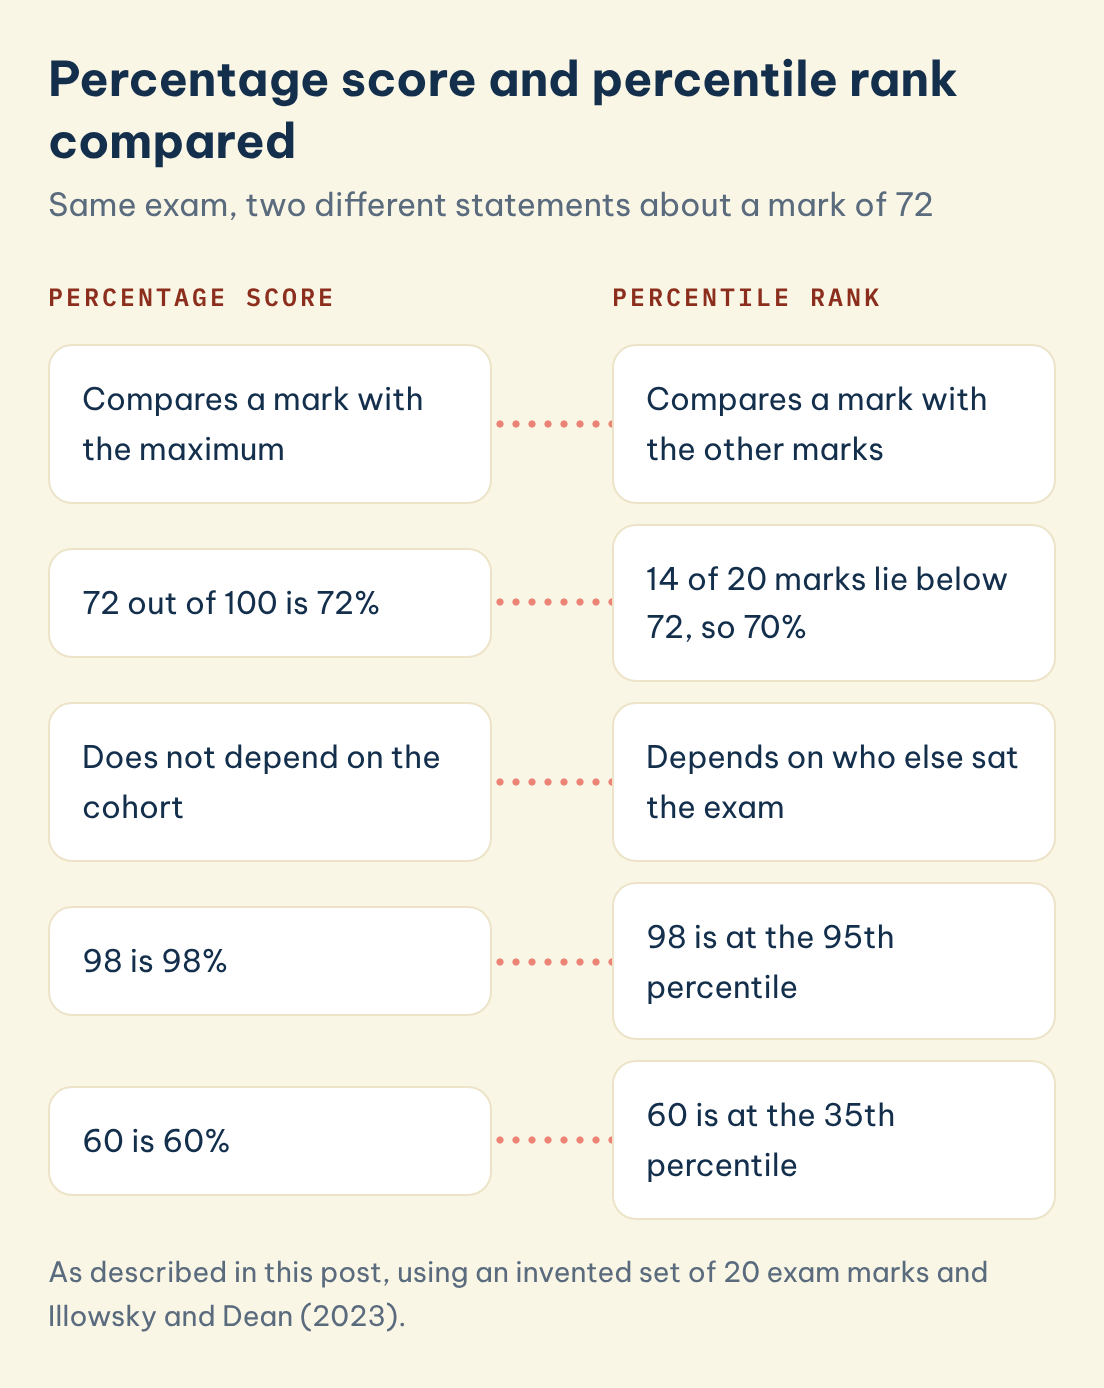
Direct answer: The 70th percentile is the value below which about 70% of the scores lie. In our 20 marks, 14 students scored below 72, so a mark of 72 sits at the 70th percentile by a simple count. The percentage score is a separate fact: 72 out of 100 is 72%.
The difference between percentage score and percentile rank is the one students confuse most often, so it is worth fixing in words. The percentage score compares a mark with the maximum available, while the percentile compares a mark with the other marks. The same mark of 72 is therefore a 72% score and a 70th percentile rank. Illowsky and Dean (2023) count slightly differently for a 20-question test: a score at the 70th percentile means 70% of students scored that value or lower. The two numbers can be far apart. A student with 98% in our set is at the top of the group, while a student with 60% sits at the 35th percentile because 7 of the 20 marks are lower.
| Mark (%) | Marks below it | Percentile rank (% of scores below) |
|---|---|---|
| 49 | 2 | 10 |
| 60 | 7 | 35 |
| 72 | 14 | 70 |
| 81 | 17 | 85 |
| 98 | 19 | 95 |
The rank used in this table is the count of scores below, divided by 20 and multiplied by 100. Other textbooks, including Illowsky and Dean (2023), count the scores at or below the value (by that rule 72 would be the 75th percentile), and some add half of any tied scores, so state which version you used when you report a percentile rank.
Percentage score and percentile rank compared
Same exam, two different statements about a mark of 72
Percentage score
Percentile rank
Compares a mark with the maximum
Compares a mark with the other marks
72 out of 100 is 72%
14 of 20 marks lie below 72, so 70%
Does not depend on the cohort
Depends on who else sat the exam
98 is 98%
98 is at the 95th percentile
60 is 60%
60 is at the 35th percentile
Save this figure
◆ Question 3 / 9 · Formula
What is the percentile formula?
Direct answer: There are two formulas. For a percentile rank, divide the number of scores below a value by the total number of scores and multiply by 100. For a percentile value, find its position with one of several definitions, such as (n + 1) × p, and interpolate between neighbouring scores.
The first formula answers the question "what percentile is this mark?", and our table above applies it: 14 / 20 × 100 = 70. The second answers the opposite question, "which mark sits at the 70th percentile?", and here there is no single universal rule. Hyndman and Fan (1996) observed: "There are a large number of different definitions used for sample quantiles in statistical computer packages" (p. 361). Their paper catalogues nine of them. The position (n + 1) × p belongs to the definition they number 6, which gives 21 × 0.70 = 14.7 for our data. Marks 14 and 15 are 70 and 72, so the 70th percentile is 70 + 0.7 × (72 − 70) = 71.4. The definition behind R's default, which they number 7, uses the position 1 + (n − 1) × p = 14.3 and returns 70.6. Both are correct under their stated rule, and the difference is the subject of a later section.
◆ Question 4 / 9 · 90th and 95th
What does 90 percentile and 95th percentile mean?
Direct answer: The 90th percentile is the value that about 90% of scores fall below, and the 95th percentile is the same idea with 95%. In our exam data they are close to 81.5 and 86.6 under the R default definition, so only the top 5% of students scored above the 95th percentile.
Roughly 95% of the marks lie below the 95th percentile and 5% lie above it. The calculation for the 95th percentile follows the same steps as before. With the R default definition, the position is 1 + 19 × 0.95 = 19.05, which lies between the 19th mark (86) and the 20th mark (98). The result is 86 + 0.05 × 12 = 86.6. With the (n + 1) × p definition the position is 19.95, which gives 86 + 0.95 × 12 = 97.4. The gap between 86.6 and 97.4 for the same data shows why high percentiles are usually the most definition-sensitive, because they sit in the thin tail where the neighbouring marks are far apart. In small samples a very high percentile therefore rests on one or two observations and should be reported cautiously. The same thing happens on the 90th percentile: 81.5 under the first definition and 85.5 under the second.
◆ Question 5 / 9 · Quartiles and IQR
What do quartiles, the IQR and the 75th percentile mean?
Direct answer: Quartiles cut ordered data into four equal parts. The first quartile Q1 is the 25th percentile, the median Q2 is the 50th, and the 75th percentile is the third quartile Q3. The interquartile range, IQR = Q3 − Q1, measures the spread of the middle half of the data.
Illowsky and Dean (2023) describe the interquartile range as a number that indicates the spread of the middle half, or the middle 50%, of the data. For our 20 marks, with the R default definition, Q1 = 56.5, the median is 64 and Q3 = 72.5, so IQR = 16. Half of the students scored between 56.5 and 72.5. The IQR is the usual companion of the median when a variable is skewed, in the same way that the standard deviation accompanies the mean; the link between the two is explained in standard deviation vs variance.
The same two numbers drive the box plot rule for outliers. Illowsky and Dean (2023) state that a value is suspected to be a potential outlier if it is less than (1.5)(IQR) below the first quartile or more than (1.5)(IQR) above the third quartile. For our data, 1.5 × 16 = 24, so the fences are 56.5 − 24 = 32.5 and 72.5 + 24 = 96.5. The mark of 38 lies above the lower fence of 32.5, so it is not flagged, but 98 lies above the upper fence, so a box plot drawn with these quartiles marks 98 as a potential outlier.
◆ Question 6 / 9 · Software differences
Why do SPSS, R and Excel give different quartiles?
Direct answer: They use different sample quantile definitions, which place the quartile at a different position between neighbouring scores. For our 20 marks Q1 is 55.5 under one definition and 56.5 under another. The differences are small, but they can change whether a borderline value is flagged as an outlier.
R's documentation states that its default is type 7, while type 6 is used by Minitab and by SPSS (R Core Team, n.d.). Hyndman and Fan (1996) wrote that the SPSS frequencies command "appears to use Q6(p), although this is nowhere documented" (p. 364), and in the same paragraph they add that Splus used Q7(p). That 1996 observation concerns an old version of the program, so treat it as history. A current IBM Community answer on the Explore procedure lists several percentile methods and notes that SPSS and Excel might use different definitions (Peck, 2024). A second IBM Community answer adds that the Frequencies procedure gives no choice of the calculation method, while Explore lets you specify both the percentiles and the method (IBM Community Support Admin, 2021).
Excel adds another layer. Microsoft documents PERCENTILE.INC, which accepts k from 0 to 1 inclusive, and PERCENTILE.EXC, which accepts k from 0 to 1 exclusive and returns an error outside that range (Microsoft, n.d.-a; n.d.-b). The pages do not publish the interpolation formula, so check the documentation of your Excel version before you state which definition it follows.
| Definition (Hyndman & Fan type) | Q1 | Median | Q3 | IQR | Upper fence | Is 98 flagged? |
|---|---|---|---|---|---|---|
| Type 6, position (n + 1)p | 55.5 | 64 | 73.5 | 18 | 100.5 | No |
| Type 7, R default | 56.5 | 64 | 72.5 | 16 | 96.5 | Yes |
| Type 8, Hyndman and Fan's recommendation | 55.8 | 64 | 73.2 | 17.3 | 99.2 | No |
The last column is the practical warning. The same exam marks, the same 1.5 × IQR rule and the same top score of 98 lead to different outlier decisions only because of the quantile definition. Hyndman and Fan (1996) recommended the type 8 definition, saying "we propose that Q8(p) is the best choice" (p. 364), and R's documentation describes the type 8 estimates as approximately median-unbiased regardless of the distribution (R Core Team, n.d.). Which one is "right" matters less than reporting which one you used.
◆ Question 7 / 9 · In SPSS
How do you get percentiles in SPSS?
Direct answer: In SPSS, go to Analyze, then Descriptive Statistics, then Frequencies, open Statistics and tick Quartiles, Cut points or Percentiles. If you need to choose the calculation method, use Analyze, Descriptive Statistics, Explore instead, or the EXAMINE syntax with a method keyword.
Kent State University Libraries (2026) describe the Frequencies route: the Statistics dialogue offers quartiles (25th, 50th and 75th), cut points for equal groups, such as 20th, 40th, 60th and 80th for five groups, and any percentiles you enter as whole numbers. To suppress the long frequency table, untick Display frequency tables. The IBM Community example for the Explore route is EXAMINE VARIABLES=salary BY educ /PLOT NONE /PERCENTILES(5,10,25,50,75,90,95,97.5) HAVERAGE. (IBM Community Support Admin, 2021), and Peck (2024) notes that HAVERAGE is the default when PERCENTILES is specified without a keyword. Its position, (w + 1)p, is the same position as the type 6 definition above. In R, quantile(x, probs = c(.25, .5, .75), type = 7) makes the choice explicit, and changing type reproduces the table above.
◆ Question 8 / 9 · Reporting
How should you report percentiles and quartiles in a dissertation?
Direct answer: State the software, the version and the quantile definition, then give the quartiles with the IQR and the sample size. Write, for example, "Q1 = 56.5, Q3 = 72.5, IQR = 16, n = 20 (R, type 7)". Say whether you mean a percentile rank or a percentage score.
Three habits protect you from marker queries. First, never write "the 70th percentile" when you mean "70%". Second, if you apply the 1.5 × IQR rule, say which quartile definition produced the fences, because the outlier list can change as in the table above. Third, when you move between programs, for example by checking an SPSS result in R, set the definition to match before you compare the numbers. A short methods sentence is enough: "Quartiles were computed in R 4.x using the default type 7 definition (Hyndman & Fan, 1996), and potential outliers were flagged beyond 1.5 times the interquartile range from the quartiles." Replace the version with the one you really used. For the shape of the distribution that the quartiles describe, see kurtosis explained.
◆ Question 9 / 9 · Expert help
Can an expert help you report percentiles and quartiles?
Most students can compute quartiles themselves once they know which definition their software applies, and building that skill is worth the effort. Help is useful when two programs give different values, when a supervisor questions an outlier decision, or when the methods text needs to match a reporting standard. MAAS has supported students since 2015 with a network of more than 100 experts. Through SPSS, R and Python help in your discipline, a MAAS expert works with you on your own data, explains the output and reviews how you report it, so you can defend each figure in your viva or marking. Our guide to thesis statistics help explains which kinds of support a university normally allows and which parts of the analysis must stay your own.
Frequently asked questions
What does percentile mean in statistics?
A percentile is a position in ranked data: the value below which a stated share of the scores lie. Illowsky and Dean (2023) describe percentiles as dividing a data set into 100 equal parts.
Is the 50th percentile the same as the median?
Yes. The median is the 50th percentile, and also the second quartile. In our 20 marks it is 64, the average of the 10th and 11th marks (63 and 65).
Is a score of 80% the 80th percentile?
Not necessarily. The percentage score compares a mark with the maximum, while the percentile compares it with the other scores. In our data, 81% is the 85th percentile by count, and 77% is the 80th.
Can the percentile formula give different answers in different software?
Yes. Hyndman and Fan (1996) describe nine definitions of sample quantiles, and R Core Team (n.d.) documents the types available in its quantile function. With only 20 scores, the difference in Q1 between two definitions was one mark.
Should I report the median and IQR or the mean and SD?
Use the median and IQR for skewed variables or those with outliers, and the mean and SD for roughly symmetrical ones. Our 20 marks are close to symmetrical, with a mean of 64.8 and a median of 64.
What does the 75th percentile mean?
It is the third quartile, Q3: the value below which about 75% of scores lie. In our data it is 72.5 under R's default definition and 73.5 under the (n + 1)p definition.
References
Hyndman, R. J., & Fan, Y. (1996). Sample quantiles in statistical packages. The American Statistician, 50(4), 361–364. https://doi.org/10.1080/00031305.1996.10473566
IBM Community Support Admin. (2021, March 26). Re: I could not calculate P97.5 on SPSS [Online forum post]. IBM Community, SPSS Statistics. https://community.ibm.com/community/user/discussion/i-could-not-calculate-p975-on-spss
Illowsky, B., & Dean, S. (2023). Introductory statistics (2nd ed.). OpenStax. https://openstax.org/books/introductory-statistics-2e/pages/2-3-measures-of-the-location-of-the-data
Kent State University Libraries. (2026, July 21). Descriptive stats for one numeric variable (Frequencies) [SPSS tutorials]. https://libguides.library.kent.edu/SPSS/FrequenciesContinuous
Microsoft. (n.d.-a). PERCENTILE.INC function. Microsoft Support. https://support.microsoft.com/en-us/office/percentile-inc-function-680f9539-45eb-410b-9a5e-c1355e5fe2ed
Microsoft. (n.d.-b). PERCENTILE.EXC function. Microsoft Support. https://support.microsoft.com/en-us/office/percentile-exc-function-bbaa7204-e9e1-4010-85bf-c31dc5dce4ba
Peck, J. K. (2024, June 19). Re: Extracting specific values from SPSS tables [Online forum post]. IBM Community, SPSS Statistics. https://community.ibm.com/community/user/ai-datascience/discussion/extracting-specific-values-from-spss-tables
R Core Team. (n.d.). Sample quantiles [Help page for quantile, R stats package]. https://stat.ethz.ch/R-manual/R-devel/library/stats/html/quantile.html
Tools & resources
Not sure how this guide applies to your own case? Talk it through with MAAS in a free 20-minute consultation.
Book a free consultation ▸