
◆ Research Methods
Standard deviation vs variance: what does each one tell you?
Variance and standard deviation both measure how spread out a set of values is around its mean, and the standard deviation is simply the square root of the variance. The difference that matters for a dissertation is the unit: variance is in squared units, so readers cannot picture it, while the standard deviation is back in the units of the data.
The unit is the reason a results chapter reports the mean with the standard deviation, while variance does its work inside tests such as ANOVA, regression and Levene's test. This guide covers the definitions, the formulas, one worked example by hand, the sample versus population choice, and how to report both in APA 7. For the wider picture of a quantitative chapter, the MAAS guide to thesis statistics shows where descriptive statistics sit.
◆ Question 1 / 7 · Variance vs SD
What is the difference between variance and standard deviation?
Direct answer: Variance is the average squared distance of each value from the mean. Standard deviation is the square root of that number, which brings the spread back to the original units. Both describe the same spread, so they always rise and fall together, but only the standard deviation can be read directly against the data.
The standard deviation also carries a picture that the variance cannot. Andrade (2020) gives the figures for a normal distribution: mean ± 1 SD covers 68.3% of the population, mean ± 2 SD covers 95.5%, and mean ± 3 SD covers 99.7%. Altman and Bland (2005) add that about 95% of observations of most distributions fall within 2 standard deviations of the mean, even when the distribution is not normal, although the values outside may all sit at one end. No equivalent rule exists for the variance, because a squared distance cannot be laid against the scale of the data.
NIST/SEMATECH (2012), in its e-Handbook of Statistical Methods, defines variance as "roughly the arithmetic average of the squared distance from the mean" and notes that squaring gives greater weight to values far from the mean: a point 2 units away adds 4 to the sum, while a point 10 units away adds 100. The same handbook states the practical difference in one line, that the standard deviation "restores the units of the spread to the original data units (the variance squares the units)". If your data are exam marks, the variance is in marks squared, a unit no examiner thinks in, whereas the standard deviation is in marks.
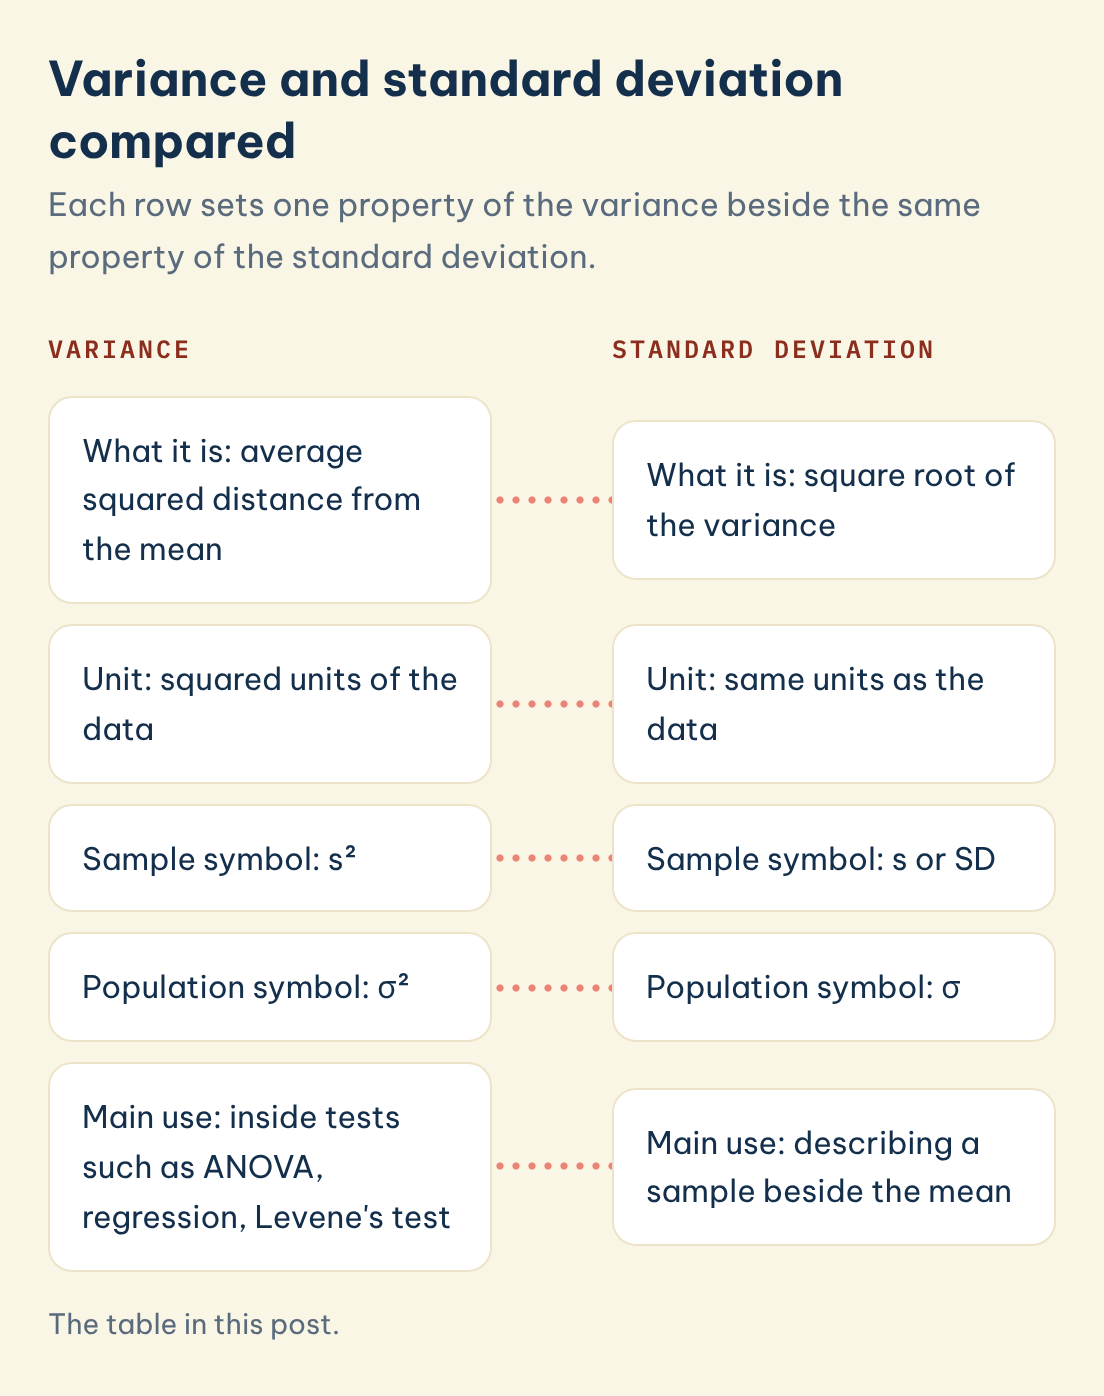
| Variance | Standard deviation | |
|---|---|---|
| What it is | Average squared distance from the mean | Square root of the variance |
| Unit | Squared units of the data | Same units as the data |
| Sample symbol | s² | s or SD |
| Population symbol | σ² | σ |
| Main use | Inside tests: ANOVA, regression, Levene's test | Describing a sample beside the mean |
| Effect of extreme values | Strong, because distances are squared | Strong, for the same reason |
Variance and standard deviation compared
Each row sets one property of the variance beside the same property of the standard deviation.
Variance
Standard deviation
What it is: average squared distance from the mean
What it is: square root of the variance
Unit: squared units of the data
Unit: same units as the data
Sample symbol: s²
Sample symbol: s or SD
Population symbol: σ²
Population symbol: σ
Main use: inside tests such as ANOVA, regression, Levene's test
Main use: describing a sample beside the mean
Save this figure
◆ Question 2 / 7 · Same thing?
Is standard deviation the same as variance?
Direct answer: No. They carry the same information but on different scales, so you cannot swap one for the other in a sentence or a table. A variance of 16 and a standard deviation of 4 describe exactly the same spread. Writing that the standard deviation is 16 would overstate the spread fourfold.
Vietnamese students who learned statistics in Vietnamese sometimes meet a related trap, because phương sai (variance) and độ lệch chuẩn (standard deviation) appear side by side in SPSS output tables. The two rows labelled Variance and Std. Deviation in the Descriptives box are the same spread expressed twice. Statistics Canada (n.d.) puts the link plainly: variance is the measure of dispersion used most often, "along with the standard deviation, which is simply the square root of the variance". Because one is derived from the other, reporting both for the same variable in a results table adds a column without adding information.
◆ Question 3 / 7 · SD squared
What is the relationship between standard deviation and variance?
Direct answer: Standard deviation equals the square root of variance, and variance equals the standard deviation squared. So yes, variance is standard deviation squared. If you know one, you know the other, which is why statistical software prints both and why textbooks write the variance as s² or σ².
The relationship also explains why variance survives at all. Squared distances can be added up and split into parts, and that is what analysis of variance does: it divides the total variance in an outcome into the part explained by group membership and the part left over. Regression does the same when it reports R², the proportion of variance in the outcome that the predictors account for. Square roots do not add up neatly, so the tests work in variance and the write-up translates back into standard deviations for the reader. Levene's test, which SPSS prints alongside an independent-samples t test, is literally a test of whether two groups have equal variances.
◆ Question 4 / 7 · Mean, SD, variance
What is the difference between mean, standard deviation, and variance?
Direct answer: The mean tells you where the centre of the data is. Variance and standard deviation tell you how far the values typically sit from that centre. Andrade (2020) summarises the pairing: the mean gives the average value, and the standard deviation gives the average scatter of values around it.
Andrade (2020) describes the standard deviation as "a descriptive statistic that estimates the scatter of values around the sample mean; hence, the SD describes the sample" (p. 409). Two classes can share a mean of 65 and still differ sharply: one where nearly everyone scored between 60 and 70, and one split between 40s and 90s. The mean alone hides that difference, which is why a mean reported without a measure of spread tells your marker very little. Statistics Canada (n.d.) adds a caution worth repeating in a methodology chapter: the standard deviation is sensitive to extreme values, and when the data set is small, asymmetric or contains extreme values, the interquartile range is often the better summary.
◆ Question 5 / 7 · The formulas
What are the standard deviation and variance formulas?
Direct answer: Sample variance is the sum of squared differences from the mean divided by n − 1. Population variance divides the same sum by N. The standard deviation in each case is the square root of the matching variance. Use the sample version whenever your data are a sample you want to generalise from.
The sample formulas, as given by NIST/SEMATECH (2012), are:
- Sample variance: s² = Σ(x − x̄)² / (n − 1)
- Sample standard deviation: s = √[Σ(x − x̄)² / (n − 1)]
- Population variance: σ² = Σ(x − μ)² / N
- Population standard deviation: σ = √σ²
Dividing by n − 1 instead of n corrects for the fact that a sample mean sits closer to its own data than the true population mean does, so dividing by n would understate the spread. SPSS, R and Excel's STDEV.S all use n − 1 by default. Excel's STDEV.P uses N, and choosing it by mistake for survey data is a common source of small mismatches between a student's table and the supervisor's rerun.
◆ Question 6 / 7 · Worked example
How do you calculate variance and standard deviation step by step?
Direct answer: Find the mean, subtract it from each value, square each difference, add the squares, then divide by n − 1 for a sample or N for a population. Take the square root to get the standard deviation. The worked example below uses five values from Statistics Canada (n.d.).
Statistics Canada (n.d.) works through the data set 2, 7, 3, 12 and 9. The sum is 33 across 5 values, so the mean is 6.6. The squared differences are 21.16, 0.16, 12.96, 29.16 and 5.76, and they add to 69.20.
| Step | Population (divide by N = 5) | Sample (divide by n − 1 = 4) |
|---|---|---|
| Sum of squared differences | 69.20 | 69.20 |
| Variance | 13.84 | 17.30 |
| Standard deviation | 3.72 | 4.16 |
Statistics Canada divides by 5 and reports a variance of 13.84 and a standard deviation of 3.72. If the same five values were a sample of a larger group, dividing by 4 gives a variance of 17.30 and a standard deviation of 4.16. If the values were minutes spent on a task, the standard deviation would read as about 4 minutes, while the variance would be 17.30 minutes squared, which is why the variance never appears in the prose of a results section.
◆ Question 7 / 7 · Reporting in APA 7
How should you report standard deviation and variance in a dissertation?
Direct answer: Report the mean with the standard deviation in APA format, for example M = 6.6, SD = 4.2 for data on a whole-number scale, and leave the variance inside the test statistics that use it. Do not join the two with a ± sign without saying which measure follows it, and do not confuse the standard deviation with the standard error.
The APA Style numbers and statistics guide (American Psychological Association, 2024) says to report means and standard deviations for data measured on integer scales, such as surveys and questionnaires, to one decimal, and other means and standard deviations to two decimals. For the worked example above, measured in whole minutes, that rounds the sample standard deviation of 4.16 to 4.2. M and SD do not need defining in an APA paper. Altman and Bland (2005) warn that "The terms 'standard error' and 'standard deviation' are often confused" (p. 903), and they draw the line clearly: use the standard deviation to say how widely scattered the measurements are, and the standard error to show the uncertainty around the estimate of the mean. They also cite a review of 88 articles published in 2002 in which 12 (14%) did not identify which measure followed the ± sign, and 3 reported no measure of variability at all. The standard error equals the standard deviation divided by the square root of the sample size, so with 100 participants it is one tenth of the standard deviation, which is why a mean ± SE looks more precise than the data are.
Frequently asked questions
Is variance the standard deviation squared?
Yes. Variance equals the standard deviation multiplied by itself, so a standard deviation of 3 means a variance of 9. Going the other way, the standard deviation is the square root of the variance.
Is standard deviation the square root of variance?
Yes, always, for both the sample and the population versions. The sample standard deviation is the square root of the sample variance, and the population standard deviation is the square root of the population variance.
Why is variance in squared units?
Each distance from the mean is squared before the distances are averaged, so the unit is squared too. Squaring stops positive and negative distances from cancelling out, and it gives extra weight to values far from the mean.
Which should I report in my results chapter?
Report the mean with the standard deviation for each continuous variable. Variance rarely needs its own column, because readers cannot interpret squared units and the information is already in the standard deviation.
What is the symbol for variance?
Sample variance is written s² and population variance σ² (sigma squared). Sample standard deviation is s or SD in APA style, and population standard deviation is σ.
Should I divide by n or n − 1?
Divide by n − 1 when your data are a sample used to estimate a wider population, which is almost every dissertation. Divide by N only when you have measured every member of the group you are describing.
Need help reading your SPSS descriptives?
If your Descriptives table shows a variance, a standard deviation and a standard error and you are not sure which belongs in your chapter, a MAAS data mentor can walk through the output with you and check that your reporting matches APA 7. See SPSS, R and Python data analysis support, where you run the analysis and write the interpretation with the guidance of a MAAS expert.
Related guides
References
Altman, D. G., & Bland, J. M. (2005). Standard deviations and standard errors. BMJ, 331(7521), 903. https://doi.org/10.1136/bmj.331.7521.903
American Psychological Association. (2024). APA Style numbers and statistics guide. https://apastyle.apa.org/instructional-aids/numbers-statistics-guide.pdf
Andrade, C. (2020). Understanding the difference between standard deviation and standard error of the mean, and knowing when to use which. Indian Journal of Psychological Medicine, 42(4), 409–410. https://doi.org/10.1177/0253717620933419
NIST/SEMATECH. (2012). Measures of scale. In e-Handbook of statistical methods (Section 1.3.5.6). National Institute of Standards and Technology. https://www.itl.nist.gov/div898/handbook/eda/section3/eda356.htm
Statistics Canada. (n.d.). Calculating the variance and standard deviation. Statistics: Power from data! https://www150.statcan.gc.ca/n1/edu/power-pouvoir/ch12/5214891-eng.htm
Not sure which spread measure belongs in your results chapter? Talk it through with a MAAS data mentor in a free 20-minute consultation.
Book a free consultation ▸