
Independent t test with d and interval
You enter: statistic = 3.514, df = 177, p = 0.0004, effect = 0.651, interval 95%: 0.35 / 0.95
The page writes
t(177) = 3.51, p < .001, d = 0.65, 95% CI [0.35, 0.95]
◆ Research methods
Type the numbers your software printed and this page writes them as one APA 7 results sentence. It sets the italics, the decimals, the zeros, the spaces and the confidence level. It only formats: it does not compute a statistic, and what the result means stays your decision.
t(177) = 3.51, p < .001, d = 0.65, 95% CI [0.35, 0.95]
Each example is run through the same engine as the builder above.
You enter: statistic = 3.514, df = 177, p = 0.0004, effect = 0.651, interval 95%: 0.35 / 0.95
The page writes
t(177) = 3.51, p < .001, d = 0.65, 95% CI [0.35, 0.95]
You enter: statistic = 4.2, df = 30, p = .000
The page writes
t(30) = 4.20, p < .001
You enter: statistic = .45, df = 48, p = 0.0009
The page writes
r(48) = .45, p < .001
You enter: effect = .5
The page writes
d = 0.50
You enter: statistic = 6.3, df = 2, df2 = 177, p = 0.002
The page writes
F(2, 177) = 6.30, p = .002
You enter: p = 0.0314
The page writes
p = .031
You enter: statistic = -.43, df = 24, p = 0.028
The page writes
r(24) = −.43, p = .028
You enter: statistic = 14.138, df = 2, N = 170, p = 0.0009
The page writes
χ2(2, N = 170) = 14.14, p < .001
You enter: statistic = 20.18, df = 1, df2 = 148, p = 0.0001, effect = .12, interval 95%: .02 / .22
The page writes
R2 = .12, F(1, 148) = 20.18, p < .001, 95% CI [.02, .22]
You enter: effect = .60, interval 95%: -0.05 / 1.25
The page writes
d = 0.60, 95% CI [−0.05, 1.25]
You enter: statistic = 4.5, df = 2, df2 = 90, p = 0.014, effect = .09
The page writes
F(2, 90) = 4.50, p = .014, η2p = .09
You enter: p = 0.08
The page writes
p = .08

To report an effect size, give its magnitude plus a 95% confidence interval, for example d = 0.52, 95% CI [0.14, 0.90], and do not rely on a p-value alone. For Vietnamese researchers preparing a first Q1 or Q2 submission, this habit often separates a manuscript that reads as statistically mature from one that draws a "revise your reporting" comment.
Effect sizes and confidence intervals are the language international-journal reviewers now expect. This guide answers the seven questions Vietnamese researchers ask MAAS publishing mentors most often when moving from a p-value-only write-up to a reportable results section.
◆ Part 1 / 11 · The rules
Direct answer: A results sentence follows ten rules: degrees of freedom in brackets after the symbol, two degrees of freedom for F, no zero before r, R² and p, exact p to three decimals, p < .001 when smaller, and the confidence level before the letters CI. Each rule below carries a code that points to its quote and source.
Rules in one results sentence
10
rules, applied in the order they appear in a results sentence, each with a code that points to its quote and source
The exact p value is given to three decimals, with no zero before the point because p cannot be larger than one.
A p value below .001 is always written p < .001, never p = .000.
The level comes first, then the letters CI, then the lower and upper limits in square brackets.
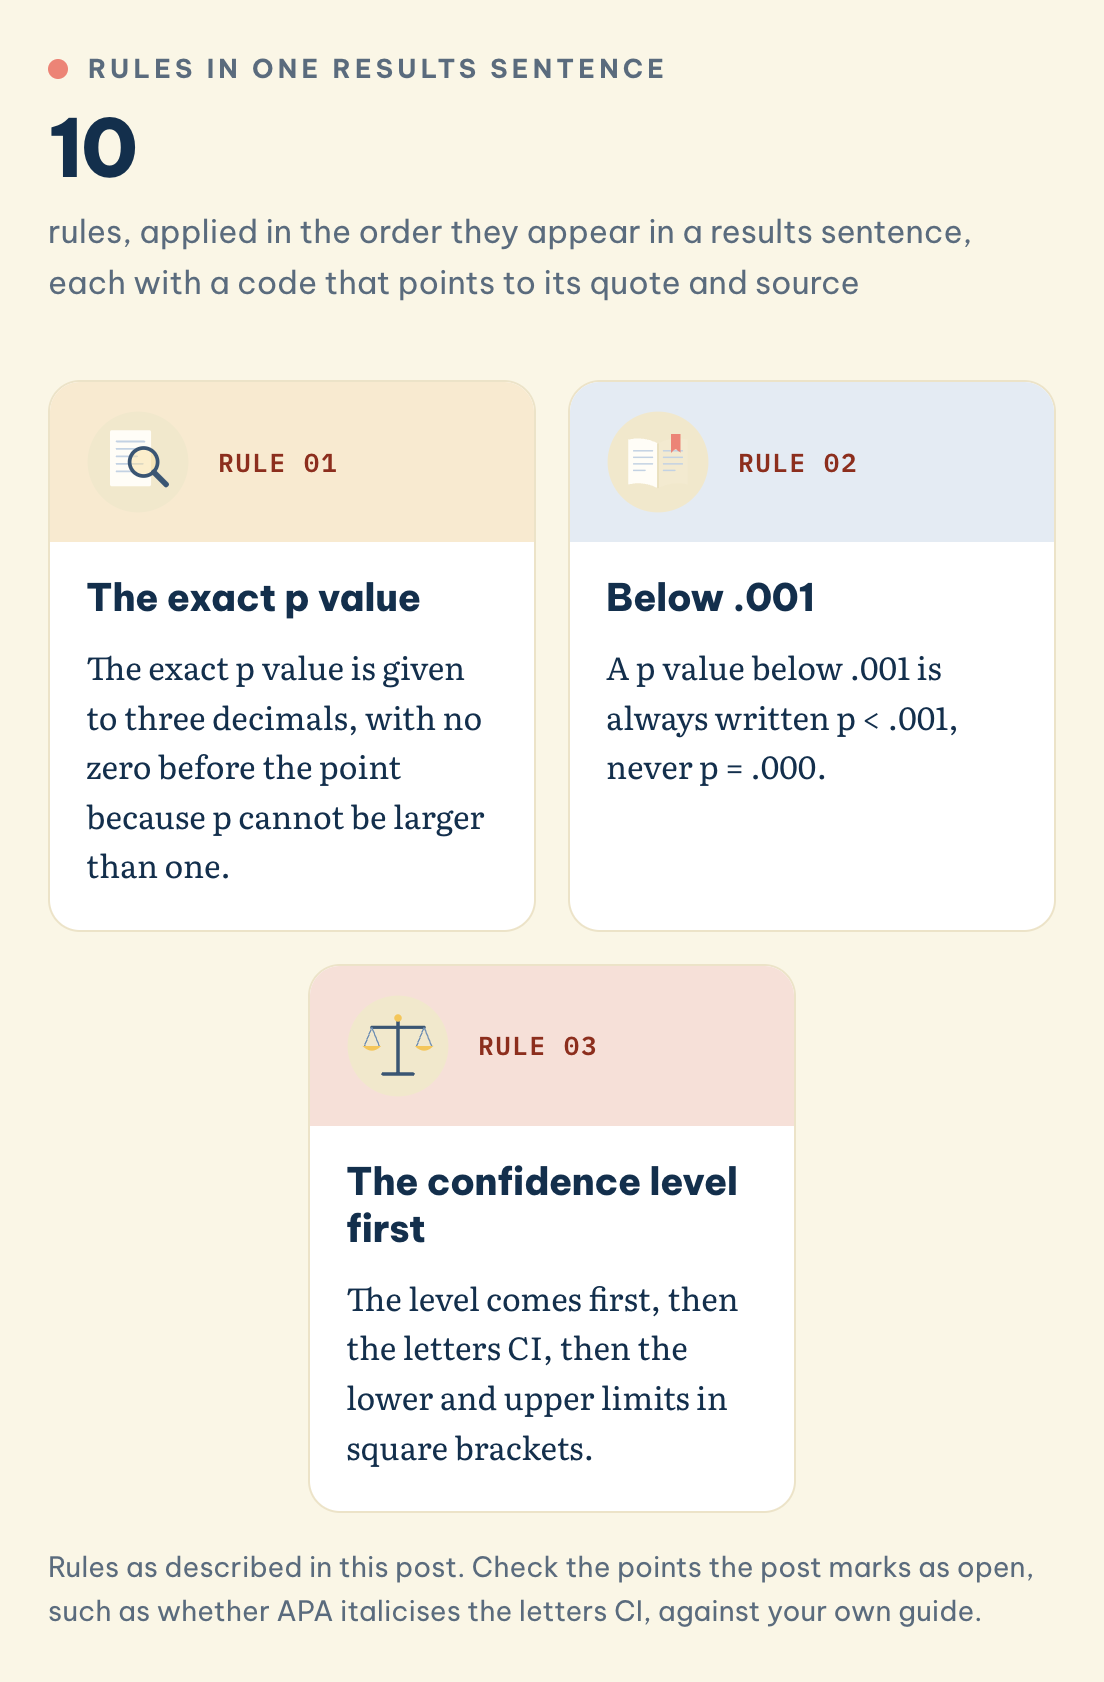
The builder applies these rules, in this order of appearance in a results sentence. Each has a quote and a source in the knowledge file.
R-T-FORMR-F-FORMR-PEARSON-FORMR-CHISQ-FORMR-R2-FORMR-ETA-PARTIALR-EXACT-PR-P-LT-001R-LEADING-ZEROR-CI-FORMATWhere the sources we read stop
This page marks a part as an assumption wherever the sources do not settle the format. Still open: whether APA italicises the letters CI (we print them upright), which exact minus glyph APA specifies (we print the true minus sign), the chi-square form, and the partial eta squared format. Check these against your own guide.
◆ Part 2 / 11 · Five slips
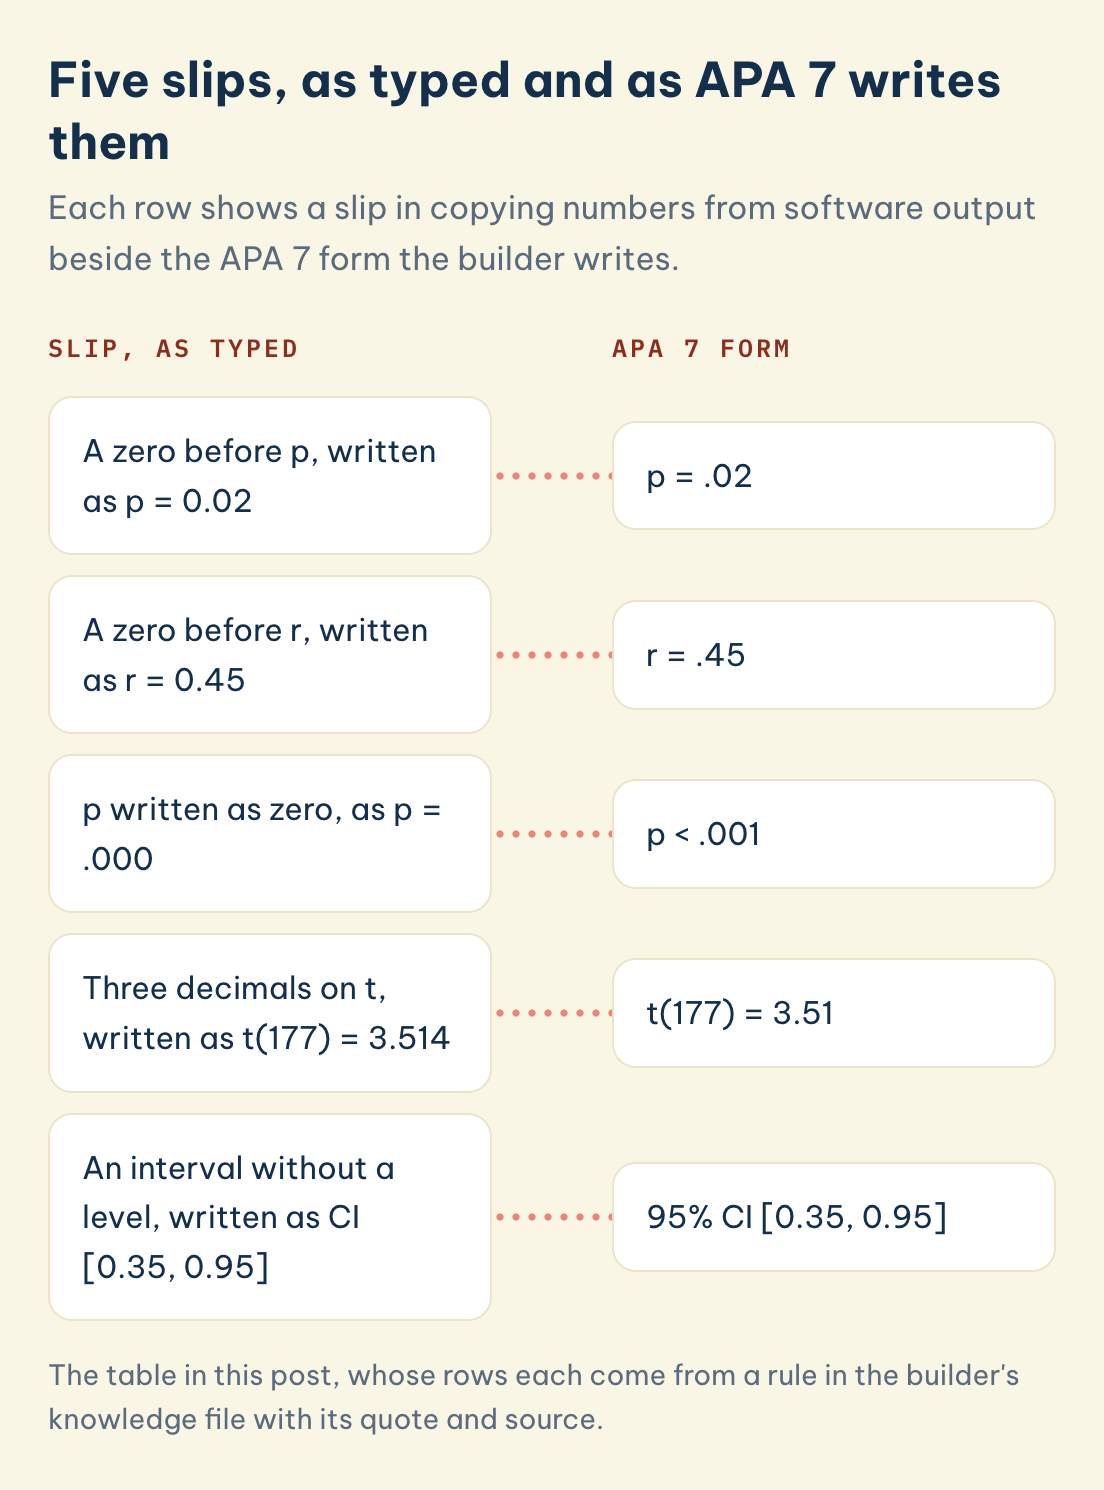
Direct answer: The builder corrects five slips in how numbers are copied from software output: a zero before p or r, p written as .000, three decimals on t, and a confidence interval without its level. The table shows each slip as typed beside the APA 7 form the builder writes.
Five slips, as typed and as APA 7 writes them
Each row shows a slip in copying numbers from software output beside the APA 7 form the builder writes.
Slip, as typed
APA 7 form
A zero before p, written as p = 0.02
p = .02
A zero before r, written as r = 0.45
r = .45
p written as zero, as p = .000
p < .001
Three decimals on t, written as t(177) = 3.514
t(177) = 3.51
An interval without a level, written as CI [0.35, 0.95]
95% CI [0.35, 0.95]
| Slip | Written as | APA 7 form |
|---|---|---|
| Zero before p | p = 0.02 | p = .02 |
| Zero before r | r = 0.45 | r = .45 |
| p written as zero | p = .000 | p < .001 |
| Three decimals on t | t(177) = 3.514 | t(177) = 3.51 |
| Interval without a level | CI [0.35, 0.95] | 95% CI [0.35, 0.95] |
Each row comes from a rule in the knowledge file, with its quote and source.
◆ Part 3 / 11 · Cohen's values
Direct answer: Cohen's conventional values are 0.20, 0.50 and 0.80 for d, and .10, .30 and .50 for r, labelled small, medium and large. Cohen himself called them operationally defined and made subjectively, so they are a convention that depends on your field, not a verdict on whether a result matters. Use them only when no better basis exists.
Cohen (1992) conventional label, field-dependent: Cohen called these values operationally defined and made subjectively, so read them against your own field.
| Statistic | Small | Medium | Large |
|---|---|---|---|
| d | 0.20 | 0.50 | 0.80 |
| r | .10 | .30 | .50 |
◆ Part 4 / 11 · Meaning
Direct answer: An effect size expresses the magnitude of a result, how big a difference or how strong a relationship is, on a standardised or meaningful scale. A confidence interval (CI) gives the range of plausible values for that effect. Together they answer "how much" and "how sure," where a p-value only answers "is it unlikely to be zero."
Evidence: Sullivan and Feinn (2012) argue that a p-value tells you only whether an effect exists, not how large it is, and that effect size is the "main finding of a quantitative study." Nakagawa and Cuthill (2007) show that pairing an effect size with its confidence interval communicates both magnitude and precision in one statement, something a significance test cannot do.
Example: A MAAS Publishing Advisory client in nursing reported only "the intervention group improved significantly (p = .02)." Her mentor helped her re-express it as a mean difference of 4.1 points, 95% CI [0.8, 7.4], Cohen's d = 0.52 so reviewers could now see the effect was moderate and estimated with real uncertainty.
◆ Part 5 / 11 · Beyond p
Direct answer: A p-value depends heavily on sample size, so a trivial effect can be "significant" in a large study and an important effect "non-significant" in a small one. Reporting the effect size and CI decouples practical importance from sample size, exactly what editors and reviewers now expect you to demonstrate.
Evidence: The American Statistical Association's formal statement warns that a p-value does not measure the size of an effect and that "Scientific conclusions and business or policy decisions should not be based only on whether a p-value passes a specific threshold" (Wasserstein & Lazar, 2016, p. 131). Cumming (2014) makes the same case under "the new statistics," urging authors to report estimates and intervals rather than lean on dichotomous significance.
Example: A Vietnamese doctoral candidate in education had a survey dataset where almost every correlation was "significant." Her MAAS mentor showed many had r values near .08, significant but practically negligible. Reporting effect sizes let her foreground the three relationships that mattered, and reviewers praised the restraint.
◆ Part 6 / 11 · Which one
Direct answer: Match the effect size to your analysis: standardised mean differences for group comparisons, correlation-family measures for associations, and variance-explained measures for models. Report the effect size your target journal's field uses most often, and state which one you chose so readers can interpret it correctly.
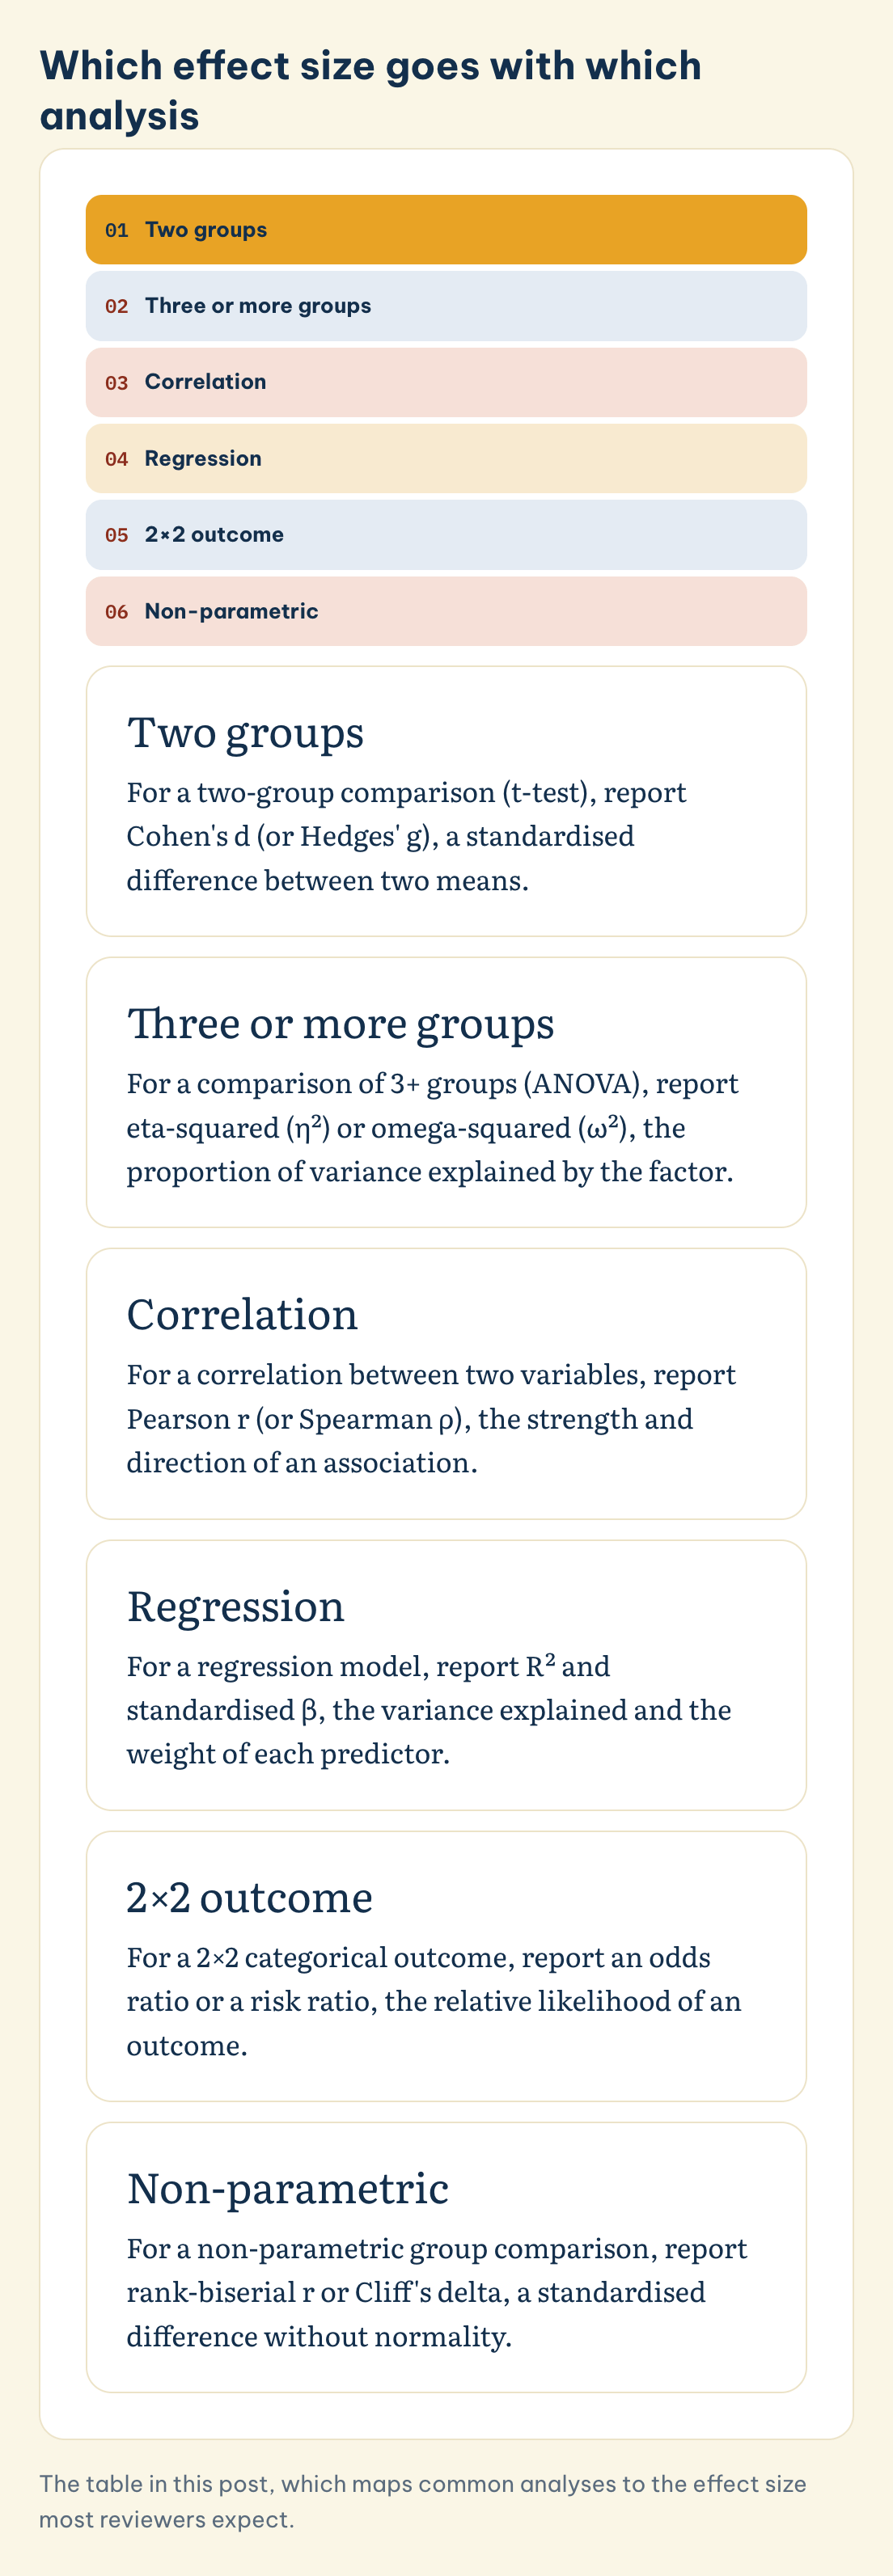
Which effect size goes with which analysis
Tap an analysis to see the effect size most reviewers expect.
Two groups
For a two-group comparison (t-test), report Cohen's d (or Hedges' g), a standardised difference between two means.
Three or more groups
For a comparison of 3+ groups (ANOVA), report eta-squared (η²) or omega-squared (ω²), the proportion of variance explained by the factor.
Correlation
For a correlation between two variables, report Pearson r (or Spearman ρ), the strength and direction of an association.
Regression
For a regression model, report R² and standardised β, the variance explained and the weight of each predictor.
2×2 outcome
For a 2×2 categorical outcome, report an odds ratio or a risk ratio, the relative likelihood of an outcome.
Non-parametric
For a non-parametric group comparison, report rank-biserial r or Cliff's delta, a standardised difference without normality.
Evidence: Lakens (2013) provides a practical primer mapping t-tests and ANOVAs to Cohen's d and eta-squared, and stresses reporting the specific estimator used. Cohen's (1988) original framework remains the reference point for the standardised families still cited across disciplines.
Example: A MAAS-coached management researcher reported only beta coefficients from a regression. Her mentor added R² for the model and standardised betas for each predictor, so the paper communicated both overall explanatory power and the relative weight of each variable, the depth her Q2 target journal expected.
The table below maps common analyses to the effect size most reviewers expect.
| Your analysis | Common effect size | What it expresses |
|---|---|---|
| Two-group comparison (t-test) | Cohen's d (or Hedges' g) | Standardised difference between two means |
| Comparison of 3+ groups (ANOVA) | Eta-squared (η²) or omega-squared (ω²) | Proportion of variance explained by the factor |
| Correlation between two variables | Pearson r (or Spearman ρ) | Strength and direction of an association |
| Regression model | R² and standardised β | Variance explained; weight of each predictor |
| 2×2 categorical outcome | Odds ratio or risk ratio | Relative likelihood of an outcome |
| Non-parametric group comparison | Rank-biserial r or Cliff's delta | Standardised difference without normality |
◆ Part 7 / 11 · Interval
Direct answer: State the confidence level (usually 95%), give the point estimate first, then the interval in square brackets. Interpret the width as precision: a narrow interval means a well-estimated effect, a wide one means your study cannot pin the effect down yet. Never describe a CI as "the probability the true value lies inside it."
Evidence: For example, report d = 0.52, 95% CI [0.14, 0.90]. Nakagawa and Cuthill (2007) recommend reporting confidence intervals for every key effect and reading their width as the study's precision. Cumming (2014) shows that intervals overlapping zero convey the same information as a non-significant test, but with far more nuance about plausible effect magnitudes.
Example: A MAAS mentor reviewed a psychology manuscript reporting d = 0.60 with no interval. Adding 95% CI [−0.05, 1.25] changed the story: the wide interval crossing zero revealed the study was underpowered, so the author reframed the result as preliminary rather than confirmatory.
If the analysis behind these numbers is the part you are unsure about, Data & Coding Projects coaches you through method design, the software, and the interpretation, so you can defend every figure you report.
◆ Part 8 / 11 · Number format
Direct answer: Write Latin-letter symbols (t, F, p, r, d, N) in italics and Greek letters upright. Report statistics and effect sizes to two decimals, exact p to three, and p < .001 when smaller. Use a zero before the decimal point only for numbers that can exceed one (t, F, d), not r or p. State the confidence level in every interval.
Evidence: The APA numbers and statistics guide tells authors to "use italics for letters used as statistical symbols or algebraic variables" and to use standard type for Greek letters (American Psychological Association, n.d.). Leave a space on both sides of an operator such as the equals sign. The Publication Manual asks authors to "report p values less than .001 as p < .001" and to give exact p values to two or three decimal places (American Psychological Association, 2020). Cohen (1992) described his conventional values for d, 0.20, 0.50 and 0.80, as "operationally defined" and said the "definitions were made subjectively", so a label such as "medium" is a convention that depends on the field. Cohen (1988, p. 25, as cited in Bakeman, n.d.) advised the labels be used "only when no better basis for estimating the ES index is available". For an ANOVA, the between-groups degrees of freedom come first, then the within-groups degrees of freedom (Hole, n.d.).
Example: Software prints t = 3.514, df = 177, p = 0.0004, d = 0.651 and a 95% interval from 0.35 to 0.95. The builder above writes t(177) = 3.51, p < .001, d = 0.65, 95% CI [0.35, 0.95]: two decimals for t and d with the zero kept, p written as below .001, and the level stated. The student then decides what the result means.
◆ Part 9 / 11 · Magnitude
Direct answer: Cohen's labels, roughly 0.2 small, 0.5 medium, 0.8 large for d, are a starting point, not a verdict. Interpret magnitude against effects typical in your own field and the practical stakes of your outcome. A "small" d can be important in a clinical or educational intervention; a "large" d can be trivial if the outcome barely matters.
Evidence: Cohen (1988) himself intended the thresholds as conventions to be used only when field-specific benchmarks were unavailable. Sullivan and Feinn (2012) caution that mechanical labelling misleads readers and urge authors to interpret effects in the context of prior studies and real-world relevance.
Example: A Vietnamese public health researcher found a d of 0.3 for a low-cost behaviour-change nudge and worried it was "too small to publish." Her MAAS mentor benchmarked it against comparable trials, where effects of 0.2 to 0.3 were the norm and valued because the intervention was cheap and scalable. Framed that way, the modest effect became the paper's selling point.
◆ Part 10 / 11 · Placement
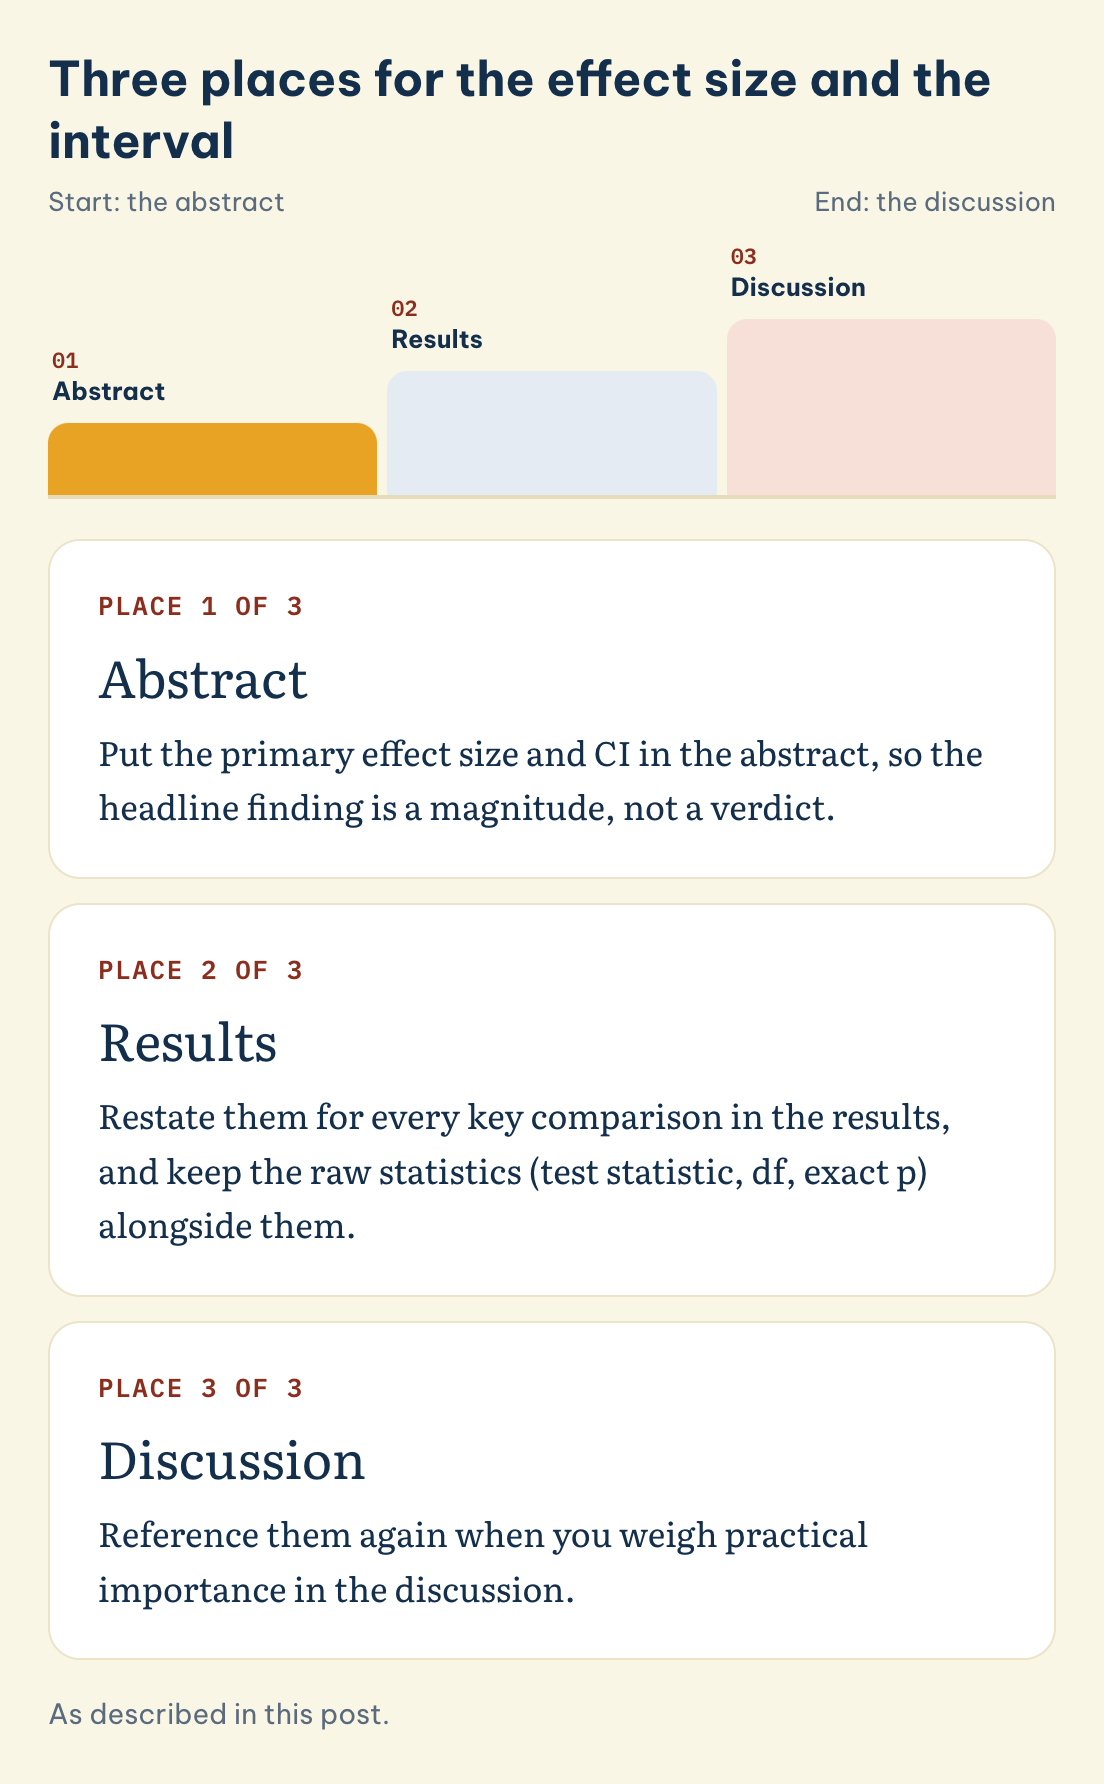
Direct answer: Put the primary effect size and CI in the abstract, restate them for every key comparison in the results, and reference them again when you weigh practical importance in the discussion. Keep the raw statistics (test statistic, df, exact p) alongside them, so the reader sees significance and magnitude together rather than choosing between the two.
Three places for the effect size and the interval
Tap a place to see what belongs there.
Place 1 of 3
Abstract
Put the primary effect size and CI in the abstract, so the headline finding is a magnitude, not a verdict.
Place 2 of 3
Results
Restate them for every key comparison in the results, and keep the raw statistics (test statistic, df, exact p) alongside them.
Place 3 of 3
Discussion
Reference them again when you weigh practical importance in the discussion.
Evidence: The SAMPL guidelines direct authors to report the magnitude of effects with confidence intervals and to give exact p-values rather than thresholds (Lang & Altman, 2015). Leading the abstract with the estimate and interval makes the headline finding a magnitude, not a verdict.
Example: A MAAS Publishing Advisory client's abstract originally said only "differences were significant." Her mentor rewrote the key sentence to "the programme raised scores by 4.1 points (95% CI [0.8, 7.4], d = 0.52)." Mirrored across results and discussion, that change led a reviewer to call the reporting "commendably transparent."
◆ Part 11 / 11 · Mistakes
Direct answer: The frequent errors are: reporting significance with no effect size; giving an effect size but no confidence interval; mixing incompatible measures across the paper; treating Cohen's labels as findings; and rounding intervals so aggressively they lose meaning. Each is cheap to fix before submission and costly to fix after a reviewer catches it.
Evidence: Lang and Altman (2015) list omission of effect magnitude and of confidence intervals among the most common statistical reporting failures in biomedical journals. Wasserstein and Lazar (2016) specifically flag over-reliance on the 0.05 threshold in place of estimation as a recurring problem.
Example: A MAAS mentor guided a Vietnamese postgraduate through three review passes of her statistics: the first fixed which effect size went with each hypothesis, the second added every confidence interval, and the third standardised the format across abstract, tables, and text. The student stayed the author throughout, with the mentor advising rather than running the analysis.
Report an effect size for every result you interpret as a finding, each key comparison, correlation, or model. You do not need one for purely descriptive checks such as a normality test, but any result you discuss as evidence should carry a magnitude and, wherever possible, a confidence interval.
Use 95% unless your field or journal specifies otherwise, because it is the near-universal default and lets reviewers compare your intervals with the wider literature. A higher level such as 99% produces wider intervals; only switch if you have a stated reason, and report the level explicitly every time.
Can I report a confidence interval instead of a p-value?
You can, and many statisticians encourage leading with the interval, but most journals still expect exact p-values alongside estimates. The safest approach is to report the effect size, its confidence interval, and the exact p-value together, so significance and magnitude are visible in the same line.
SPSS, R, Stata, and JASP all produce effect sizes and intervals, sometimes as an option you must switch on. In R, packages in the effect size family return standardised measures with intervals; recent SPSS versions print them in the output. State the software and version in your methods section.
Yes. A non-significant result still has an estimated effect size and a confidence interval, and reporting them is more honest than saying "no effect." A wide interval crossing zero tells readers your study could not resolve the effect, which is useful information for future meta-analysis.
Yes. MAAS Publishing Advisory coaches Vietnamese researchers through analysis planning, effect size selection, confidence interval reporting, and results-section writing using a phase-by-phase model, with developmental feedback from PhD-level mentors. Book a consultation through our contact page.
Can I write p = .000?
No. APA asks you to report p values less than .001 as p < .001, so a software output of .000 is written p < .001. The builder does this for you, including when you type .000 or 0.
Effect sizes and confidence intervals are decided when you plan the analysis, not bolted on at the end, and they are far easier to get right with an adviser whose own papers have come through peer review. MAAS Publishing Advisory reviews a manuscript section by section, starting with the abstract, tables and figures and then moving to methods and results, the sections where you report effect sizes and intervals. Each adviser holds multiple Q1 or Q2 papers under their own name, and 23% of MAAS experts hold a PhD. MAAS matches you within 48 hours when our network already covers that field. If it does not, MAAS opens a dedicated recruitment round for your case, which usually takes about two weeks. Everything starts with a free 20-minute consultation. We coach; you stay the author, every step.
Book a Publishing Advisory consultation →
This article is part of the MAAS Journal series for Vietnamese international postgraduate students and researchers. MAAS Publishing Advisory is an advisory partner; we coach authors through a phase-by-phase delivery model with developmental feedback from PhD-level, Scopus-published mentors. We do not write, submit, or guarantee acceptance of work on an author's behalf.
A free 20-minute consultation with a MAAS publishing mentor, to talk through your own analysis and results section.
Book Free Discovery ▸