
◆ Research Methods
Mean, median or mode: which measure should you use?
The mean suits roughly symmetrical numeric data, the median suits skewed data or ordinal scales, and the mode is the only choice for nominal categories. The Australian Bureau of Statistics (2023) shows how the three answers differ on one small dataset. Your decision depends on the level of measurement and the shape of the distribution.
◆ Question 1 / 8 · What are the measures
What are the measures of central tendency?
Direct answer: The measures of central tendency are the mean, the median and the mode. Laerd Statistics (n.d.) describes a measure of central tendency as "a single value that attempts to describe a set of data". Each one picks a different centre, so they can give different answers on the same data.
The 3 measures answer slightly different questions. The mean is the arithmetic balance point of all values, the median is the middle observation once the values are put in order, and the mode is the value that appears most often. The Australian Bureau of Statistics (2023) defines the mode as "the most commonly occurring value in a distribution" and the median as "the middle value in distribution when the values are arranged in ascending or descending order". It defines the mean as the sum of the value of each observation divided by the number of observations.
Students often report all 3 out of habit, but the better question is which one your reader needs. A supervisor reading a results chapter wants to know what a typical participant looks like, and the honest answer depends on how your variable is measured and how it is spread. The rest of this post gives you a way to decide, using one worked dataset and one table you can adapt to your own variables.
◆ Question 2 / 8 · What is the definition
What is the definition of central tendency?
Direct answer: Central tendency means summarising a dataset with one value near which the observations cluster. Manikandan (2011b) calls the mean the most frequently used choice, yet the same two-page paper names four situations in which the median is preferred, so the definition always comes with a decision.
The definition is deliberately loose, because "centre" has more than one meaning. If you imagine the data laid out on a number line, the mean is where the line would balance, the median is the point with half of the observations on each side, and the mode is the tallest peak. Manikandan (2011b, p. 214) writes that "Fifty percent of observations in a distribution have scores at or below the median", which is the clearest way to remember what the median does.
When your examiner asks you to justify a summary statistic, they are usually testing whether you know that the measures can disagree. A single number never describes spread, so central tendency is normally reported next to a measure of dispersion. If you want the companion topic, our guide to choosing the right statistical test shows where descriptive summaries sit before any hypothesis test is run.
◆ Question 3 / 8 · What are the four types
What are the four types of averages?
Direct answer: The usual answer is mean, median and mode, with the mean sometimes split into arithmetic, geometric and harmonic versions. Manikandan (2011a) covers all three means and notes that the arithmetic mean is at least as large as the geometric mean, which is at least as large as the harmonic mean, for positive values.
The question "what are the four types of averages" has no single textbook answer, so say which list you are using. One common reading counts mean, median, mode and range, but range is a measure of spread, not of centre. A cleaner reading for a dissertation counts the arithmetic mean, the median, the mode and the geometric mean. Manikandan (2011a) reports that when all the values are identical, the three kinds of mean are identical too.
For most coursework the arithmetic mean is what people mean by "the mean". The geometric mean matters when values grow by multiplication, and Manikandan (2011b, p. 215) notes that it is preferred for a logarithmic scale. Unless your data are of that kind, state that you used the arithmetic mean and move on. Naming the type you used avoids the vague wording that examiners tend to flag.
◆ Question 4 / 8 · How do you calculate
How do you calculate the mean, median and mode?
Direct answer: For the mean, add the values and divide by how many there are. For the median, order the values and take the middle one. For the mode, find the value that occurs most often. The Australian Bureau of Statistics (2023) works through eleven ages: the mode is 54, the median is 57 and the mean is 56.6.
The ABS example uses 11 ages: 54, 54, 54, 55, 56, 57, 57, 58, 58, 60, 60. The ABS page, released on 2 February 2023, gives the three results as follows.
- Mode: 54 appears 3 times, while 57, 58 and 60 each appear 2 times, so the mode is 54 (Australian Bureau of Statistics, 2023).
- Median: with 11 values, the middle one is the sixth, which is 57 (Australian Bureau of Statistics, 2023).
- Mean: the values sum to 623, and 623 divided by 11 gives 56.6 (Australian Bureau of Statistics, 2023).
Notice that the 3 results (54, 57 and 56.6) differ even though the 11 ages run only from 54 to 60, a spread of 6 years. The Australian Bureau of Statistics (2023) then adds a twelfth person aged 52. With an even count there is no single middle value, so the median becomes the mean of the 6th and 7th of the 12 values, which are 56 and 57, giving 56.5. It is easy to report 56 or 57 by mistake for an even-sized sample. The ABS page shows its working step by step, and doing the same in an appendix lets a marker retrace it.
◆ Question 5 / 8 · When is the median better
When is the median better than the mean?
Direct answer: Use the median when the distribution is skewed or contains outliers. Laerd Statistics (n.d.) states that "The mean has one main disadvantage: it is particularly susceptible to the influence of outliers", while the median "is less affected by outliers and skewed data".
The reason is mechanical. In Manikandan's words, "As mean is always pulled toward the extreme observations, the mean is shifted to the tail in a skewed distribution" (Manikandan, 2011b, p. 215). The median does not move that way, and the same paper notes that "Median lies in between the mean and the mode in a skewed distribution." Laerd Statistics (n.d.) adds that the more skewed the distribution, the greater the difference between the median and mean. To see how the shape of the data produces this pull, read left versus right skewed distributions.
Manikandan (2011b, p. 215) gives 4 situations where the median is preferred to the mean: few extreme scores, some scores with undetermined values, an open-ended distribution, and an ordinal scale. Bhandari (2022) agrees that for a skewed distribution the median is the best measure because extreme outliers do not affect it. A practical habit is to compute both, and if they differ noticeably, treat the gap as evidence of skew and report the median. Our guide on what statistics help you can get for a thesis explains where checking this sits in the wider analysis process.
◆ Question 6 / 8 · When should you use the mode
When should you use the mode?
Direct answer: Use the mode for nominal data, where categories have no order, and to describe a distribution with two peaks. Manikandan (2011b, p. 214) calls it "the only measure of central tendency that can be used for data measured in a nominal scale" and says it is rarely used otherwise.
Imagine a survey asking which transport mode students use: bus, bike, train or car. The mean of those labels is meaningless and the median needs an order that does not exist, so the most frequent category is the only sensible summary (Manikandan, 2011b). The Australian Bureau of Statistics (2023) cautions that a dataset can have more than one mode or none at all, which limits how much weight the mode can bear when the data are numeric.
Manikandan (2011b, p. 214) also notes that the mode is rarely used as a summary statistic except to describe a bimodal distribution. If a histogram of your scores shows two humps, reporting a single mean would hide the fact that you have two subgroups. In that case describe both peaks, and consider whether your sample mixes two populations that should be analysed separately. That observation often becomes a useful point in a discussion chapter.
◆ Question 7 / 8 · Which measure fits
Which measure fits which level of measurement?
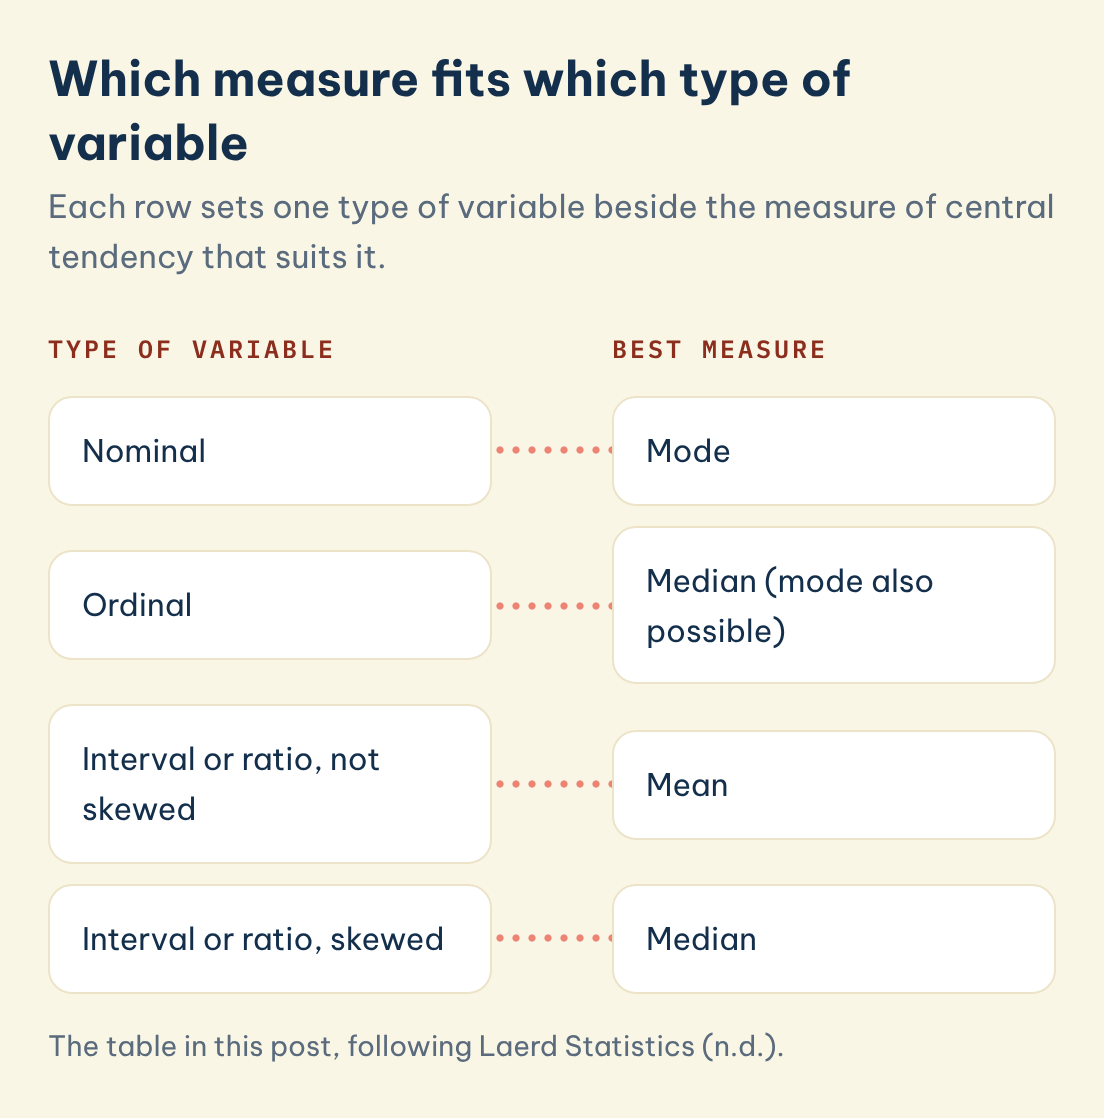
Direct answer: Match the measure to the scale: mode for nominal data, median for ordinal data, mean for interval or ratio data that are not skewed, and median for interval or ratio data that are skewed. Laerd Statistics (n.d.) sets out this pairing in a table, and the table below follows it.
Which measure fits which type of variable
Each row sets one type of variable beside the measure of central tendency that suits it.
Type of variable
Best measure
Nominal
Mode
Ordinal
Median (mode also possible)
Interval or ratio, not skewed
Mean
Interval or ratio, skewed
Median
Save this figure
| Type of variable | Best measure | Why |
|---|---|---|
| Nominal | Mode | Categories have no order, so only the most frequent can be named |
| Ordinal | Median (mode also possible) | Order exists but gaps between ranks are not equal |
| Interval or ratio, not skewed | Mean | Uses every value, and suits roughly symmetrical data |
| Interval or ratio, skewed | Median | Not pulled toward the tail by extreme values |
Sources differ slightly on the ordinal row. Laerd Statistics (n.d.) lists the median, while Bhandari (2022) says ordinal data can use the mode and the median and that interval and ratio data can use all three. Neither is wrong, and the safe approach is to give the median and mention the mode if one category clearly dominates. The Australian Bureau of Statistics (2023) adds that the median cannot be used for nominal data and that the mean cannot be calculated for categorical data.
◆ Question 8 / 8 · How do you report measures
How do you report measures of central tendency in a dissertation?
Direct answer: Report the measure with its symbol, such as M for the mean, round sensibly and avoid repeating the same figures in text and in a table. The American Psychological Association (APA, 2024) numbers and statistics guide says to report means and standard deviations for integer scales to one decimal.
The two-page APA (2024) guide gives three rules that apply directly, and its examples sit on page 2. Use the symbol or abbreviation for statistics with a mathematical operator, for example M = 7.7. In running text, "Use the term, not the symbol, for statistics in the text (e.g., "the means were")". And "Do not repeat statistics in both the text and a table or figure." That last rule matters in a results chapter, where it is tempting to restate every cell of a table in a paragraph.
A tidy pattern is to put the full set of descriptive statistics in one table and use the text to point at the one or two figures that matter for your argument. If the data are skewed, say so, state that you chose the median, and give a reason such as the gap between the mean and the median. A short justification also shows that your choice was deliberate. If you want a mentor to look over your descriptives section, data analysis support for SPSS, R and Python from MAAS is advisory: an expert walks you through the analysis and feedback, while you run the analysis and write the results yourself.
Frequently asked questions
What are the three measures of central tendency?
The mean, the median and the mode. The Australian Bureau of Statistics (2023) defines each: the mean is the sum divided by the number of observations, the median is the middle value in order, and the mode is the most common value, as in its 11 ages from 54 to 60 (Australian Bureau of Statistics, 2023).
Which measure is best for skewed data?
The median. Laerd Statistics (n.d.) says it is less affected by outliers and skewed data, and Bhandari (2022) calls it the best measure for a skewed distribution.
Can the mean, median and mode be the same?
Yes, in a perfectly symmetrical single-peaked distribution they coincide. Manikandan (2011b, p. 215) notes that in a skewed distribution the median lies between the mean and the mode, so a gap between them signals skew (Laerd Statistics, n.d.), as in the ABS ages where 54, 57 and 56.6 all differ.
Why is the mean the most used measure?
Manikandan (2011b, p. 215) states it is generally considered the best measure of central tendency and the most frequently used one. It uses every value, which is also why it reacts to outliers (Laerd Statistics, n.d.).
How do I find the median of an even number of values?
Order the values and take the mean of the two middle ones (Australian Bureau of Statistics, 2023). The Australian Bureau of Statistics (2023) shows 12 ages giving a median of 56.5, the mean of 56 and 57.
How many decimals should I report for a mean?
The APA (2024) guide says to report means and standard deviations for data on integer scales, such as surveys and questionnaires, to one decimal place (American Psychological Association, 2024).
References
American Psychological Association. (2024). APA Style numbers and statistics guide. https://apastyle.apa.org/instructional-aids/numbers-statistics-guide.pdf
Australian Bureau of Statistics. (2023). Measures of central tendency. https://www.abs.gov.au/statistics/understanding-statistics/statistical-terms-and-concepts/measures-central-tendency
Bhandari, P. (2022, December 31). Central tendency: Understanding the mean, median & mode. Scribbr. https://www.scribbr.co.uk/stats/measures-of-central-tendency/
Laerd Statistics. (n.d.). Measures of central tendency: Mean, mode and median. Lund Research. https://statistics.laerd.com/statistical-guides/measures-central-tendency-mean-mode-median.php
Manikandan, S. (2011a). Measures of central tendency: The mean. Journal of Pharmacology and Pharmacotherapeutics, 2(2), 140–142. https://doi.org/10.4103/0976-500X.81920
Manikandan, S. (2011b). Measures of central tendency: Median and mode. Journal of Pharmacology and Pharmacotherapeutics, 2(3), 214–215. https://doi.org/10.4103/0976-500X.83300
Not sure how this guide applies to your own case? Talk it through with MAAS in a free 20-minute consultation.
Book a free consultation ▸