
◆ Research Methods
What are the main mixed methods research designs?
The main mixed methods research designs are convergent, explanatory sequential and exploratory sequential. Berkovic (n.d.) states that there are three, and Fetters et al. (2013) add four advanced frameworks built from them. Your choice depends on whether the strands run in parallel or in order, and on how you plan to integrate them.
◆ Question 1 / 10 · Types of design
What are the different types of mixed methods research designs?
Direct answer: Three basic designs are described across the sources: convergent, explanatory sequential and exploratory sequential. Berkovic (n.d.) labels them "Combine", "Explain" and "Develop". They differ in when each strand happens, which strand leads, how the samples relate, and where the integration takes place.
The three basic mixed methods designs
Tap a design to see its order of strands and its sample link.
Convergent
Order: both strands in parallel. Purpose: combine. Sample link: the same sample, or two samples compared.
Explanatory sequential
Order: quantitative, then qualitative. Purpose: explain. Sample link: the qualitative sample is drawn from the quantitative participants and is usually smaller.
Exploratory sequential
Order: qualitative, then quantitative. Purpose: develop. Sample link: quantitative participants are recruited separately from the qualitative phase.
Save this figure
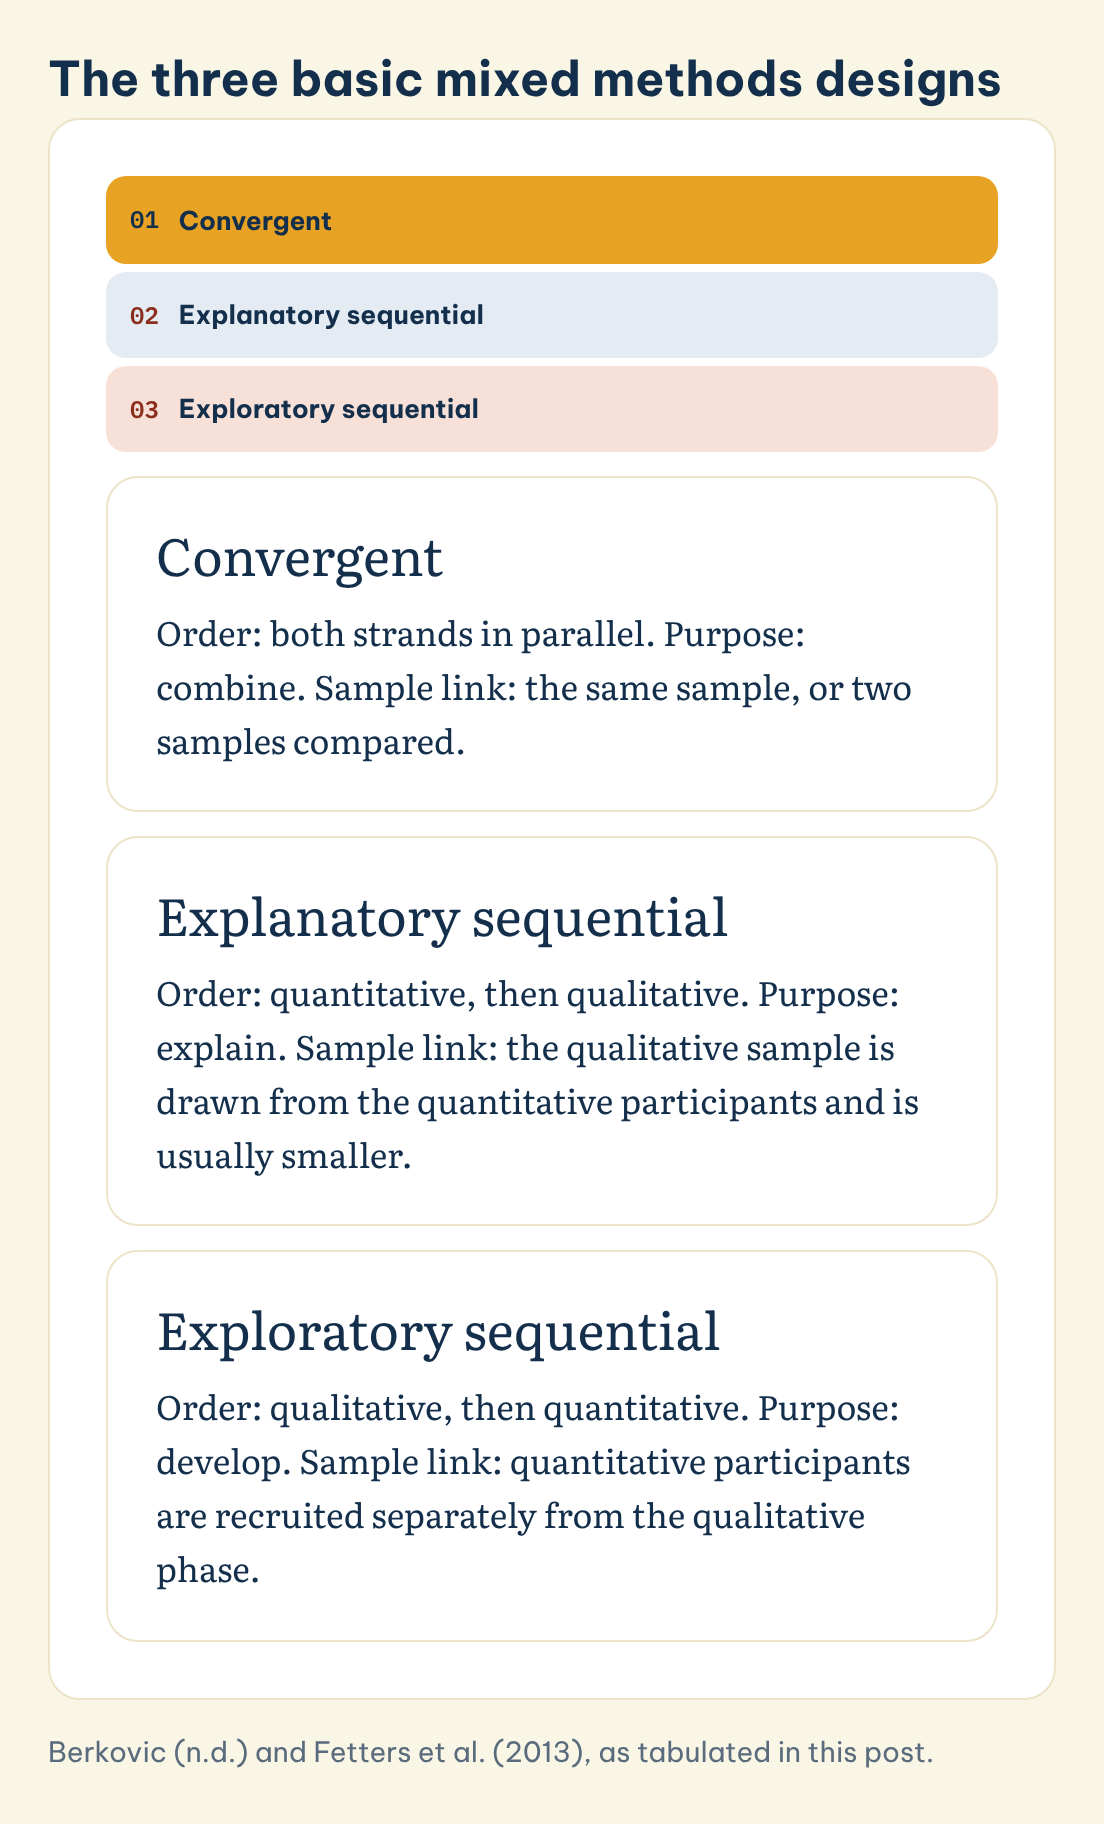
If you want the wider comparison of qualitative, quantitative and mixed approaches, our guide on how to choose between qualitative, quantitative and mixed methods covers it, and this post assumes you have already decided that two kinds of data are needed. Here the question is which of the three designs fits. The table pulls together the points that Berkovic (n.d.) and Fetters et al. (2013) report for each one.
| Design | Order of strands | Purpose in Berkovic (n.d.) | Typical sample link |
|---|---|---|---|
| Convergent | Both strands in parallel | Combine | Same sample |
| Explanatory sequential | Quantitative, then qualitative | Explain | Qualitative sample drawn from the quantitative participants, usually smaller |
| Exploratory sequential | Qualitative, then quantitative | Develop | Quantitative participants recruited separately from the qualitative phase |
Younas and Durante (2023) use the same three-design typology and map 14 integration procedures onto it, so these labels give your methodology chapter a shared vocabulary with the literature. Older papers may use different names. Berkovic (n.d.) notes that work written before 2021 can describe the same thinking as "triangulation" or "embedded" designs, which matters when you read the literature for your own methodology chapter.
◆ Question 2 / 10 · Four types?
What are the four main types of mixed methods designs?
Direct answer: The sources describe three basic designs, not four. Fetters et al. (2013) add four advanced frameworks that build on them: multistage, intervention, case study and participatory designs. Check which typology your supervisor expects before you name your design in your proposal.
The "four types" question appears often in search results, and the honest answer is that it depends on the author. In the typology that Younas and Durante (2023) follow, there are three core designs, each with variants. Convergent has four variants (parallel database, data transformation, questionnaire and fully integrated). Explanatory sequential has two (follow-up explanations and case selection). Exploratory sequential has four (new variable development, instrument development, intervention development and digital tool development).
Fetters et al. (2013) place the advanced frameworks one level above these. Their four frameworks are multistage, intervention, case study and participatory designs, and they sit on top of the three basic designs rather than replacing them. Berkovic (n.d.) also mentions embedded designs when explaining older terminology. In our experience, a taught dissertation usually needs only one of the three basic designs.
◆ Question 3 / 10 · Convergent
What is a convergent mixed methods design?
Direct answer: In a convergent design you collect and analyse the qualitative and quantitative data at about the same time, then merge them to compare. Fetters et al. (2013) say the intent is to merge the phases so that the two sets of results can be compared.
Fetters et al. (2013) describe the common and technically simpler version: data collection runs in parallel, the two forms of data are frequently analysed separately, and integration begins well after collection has proceeded or finished. Berkovic (n.d.) lists the main risk. Unequal sample sizes may leave one strand with insufficient power, but equalising them can compromise rigour. Merging numbers with words is also described as challenging.
Planning matters more here than in the sequential designs. Fetters and Tajima (2022) say that for convergent studies the integration intent is "matching", decided before data collection, so questions and items in the two strands line up and merging is easy later. A useful habit is to write the interview guide and the questionnaire from the same list of constructs, so each survey scale has a matching interview prompt. If the strands are designed separately, you can end up with two good studies and nothing to compare.
◆ Question 4 / 10 · Explanatory
What is an explanatory sequential design?
Direct answer: An explanatory sequential design collects quantitative data first, then uses qualitative data to explain the numbers. Fetters et al. (2013) illustrate it with surveys on anxiety, depression and pain followed by semistructured interviews. The qualitative sample is usually drawn from the quantitative participants.
The logic of the explanatory design is simple: measure, then ask why. Younas and Durante (2023) describe two variants. In the follow-up explanations variant the quantitative strand is emphasised and the interviews clarify its results. In the case-selection variant the qualitative strand is prioritised and the survey is used to choose which cases to study.
Berkovic (n.d.) points out the practical trap. The qualitative phase cannot be fully planned in advance, because you do not know which results will need explaining until the quantitative analysis is finished, and two phases take time. In a dissertation timeline, that means leaving a gap between the survey closing and the first interview, and getting ethics approval for the interview stage in a form that allows its content to depend on the survey. Fetters and Tajima (2022) describe the integration here as connecting (sampling for the second phase from the first) and building (the quantitative findings shape the interview questions).
◆ Question 5 / 10 · Exploratory
What is an exploratory sequential design?
Direct answer: An exploratory sequential design collects qualitative data first, then builds a quantitative phase from what was found. Berkovic (n.d.) says its purpose is to develop, and that quantitative participants should not be recruited from the qualitative phase, to avoid confirmatory bias.
You choose this design when you cannot yet measure the thing you care about. The qualitative phase gives you themes, codes and quotes, and Fetters and Tajima (2022) describe how these are used to build the scales, stems and items of the quantitative instrument. Younas and Durante (2023) list four variants: new variable development, instrument development, intervention development and digital tool development.
The difficulty is the mirror image of the explanatory design. Berkovic (n.d.) notes that the quantitative phase cannot be planned before the qualitative analysis is complete, so your sample size, instrument and analysis plan are all provisional until then. In our experience, examiners ask how you moved from themes to items, so keep a record of each step. A short table that lists each theme, the item you wrote from it and the reason for any change gives you a trail you can place in an appendix. The same table can later serve as your joint display.
◆ Question 6 / 10 · Integration
How do you integrate the two strands of a mixed methods study?
Direct answer: Integrate at three levels: design, methods and interpretation. Fetters et al. (2013) name four ways to do it in the methods: connecting, building, merging and embedding. A joint display then shows the integrated results. Younas and Durante (2023) quote Bazeley's description of integration as "purposeful interdependence" between sources.
The 2013 paper by Fetters et al. is a widely cited statement of these levels, and it defines the four methods-level techniques concisely. Connecting means selecting interview participants from survey respondents. Building means writing survey items from earlier qualitative data, as in the adaptation of a national patient survey where interviews found new domains such as gender relations, diet and interpreter use. Merging means bringing two databases together for comparison. Embedding means linking at several points, especially in intervention trials.
Integration is also where many studies fail. Younas and Durante (2023) report that reviews find integration is generally not adequately implemented, which risks unanswered questions, missed insight and, in some cases, erroneous conclusions. O'Cathain et al. (2010) go further, arguing that without integration the study yields no more knowledge than separate qualitative and quantitative studies would. They also name a barrier: the absence of formal education in mixed methods. Treat your integration plan as a section of the methodology chapter, not something to improvise in the discussion.
◆ Question 7 / 10 · Joint displays
How do joint displays and integration techniques work?
Direct answer: A joint display brings the two data types together in a figure, table, matrix or graph to draw out insights beyond either alone. O'Cathain et al. (2010) offer three techniques for the analysis: a triangulation protocol, following a thread, and a mixed methods matrix.
Fetters et al. (2013) describe a joint display as a visual means of bringing the data together so as to reveal new insights beyond the separate results. Younas and Durante (2023) list example types, including statistics-by-themes, participant selection, instrument development and side-by-side displays. Berkovic (n.d.) suggests a side-by-side table for convergent and explanatory designs and arrows linking qualitative findings to instrument development for the exploratory design.
O'Cathain et al. (2010) give you the analysis techniques that fill such a display. In a triangulation protocol, the findings from each component are listed on one page and classed as agreement, partial agreement, silence or dissonance. In following a thread, you pick a theme or question from one component and trace it across the other; their example combined 22 interviews with a survey of 911 respondents and tested a hypothesis from the interviews in the survey. A mixed methods matrix puts cases in rows and data in columns so you can spot surprises on a single case. O'Cathain et al. (2010) caution that the techniques help only when applied with expertise.
◆ Question 8 / 10 · Disagreement
What should you do when the qualitative and quantitative results disagree?
Direct answer: Disagreement is a finding, not a failure. Fetters et al. (2013) describe three kinds of fit: confirmation, expansion and discordance. O'Cathain et al. (2010) write that disagreement is not a sign that something is wrong with a study, so report it and look for reasons.
Fetters et al. (2013) define "fit" as the coherence of the quantitative and qualitative findings. Confirmation means both data types agree, which adds credibility. Expansion means the findings diverge in a way that extends insight, for example when the quantitative data show the strength of an association and the qualitative data show its nature. Discordance means the findings are inconsistent or contradictory. Younas and Durante (2023) give an example from resilience research, where caregiver depression had a significant effect, caregiver burden had none, and the interviews identified two resilience-promoting factors absent from the survey.
For discordance, Fetters et al. (2013) list several options: look for bias, examine methodological assumptions, gather more data, re-analyse, seek explanations from theory, or challenge construct validity. Choose the option that fits your design, and say so in the discussion chapter. An examiner is more likely to trust a student who explains a mismatch openly than one who shows only tidy agreement.
◆ Question 9 / 10 · Examples
What are some mixed methods research examples?
Direct answer: The sources give worked examples for each design. Fetters et al. (2013) describe surveys on anxiety, depression and pain followed by interviews (explanatory) and interviews with medical students, residents and faculty followed by an online survey (exploratory). O'Cathain et al. (2010) describe interviews and a survey run together.
The examples above are health studies because most of the sources cited here come from health research. Newcastle University (n.d.) lists doctoral theses that used a convergent parallel design and a sequential design, which shows the designs are also used in UK doctoral research, though the page gives no discipline-specific detail. For a business or education dissertation, the translation is direct: a customer survey followed by interviews with customers who gave unexpected answers is explanatory sequential, and interviews with managers that feed the wording of a staff questionnaire is exploratory sequential.
One caution applies to every example. Bryman (2006) analysed 232 social science articles that combined the two approaches and found that the rationales researchers gave for mixing and the way mixing was used in practice did not always correspond. When you read an example, check whether the paper actually integrated its data, or only reported two sets of results side by side. Copy the integration, not just the label. Newcastle University (n.d.) adds that mixed methods remains a novelty in fields such as business and management, so you may need to justify the choice more carefully there.
◆ Question 10 / 10 · Justifying it
How do you justify your design in a methodology chapter?
Direct answer: State your research question, name the design, and give a reason for mixing, the order, the priority and the point of integration. Johnson et al. (2007) define the field as combining elements of qualitative and quantitative approaches, so your chapter must show why both were needed.
Mixed methods has a precise definition: "the type of research in which a researcher or team of researchers combines elements of qualitative and quantitative research approaches" (Johnson et al., 2007, p. 123). Use that wording to anchor your definition, then show that your question cannot be answered by one strand. A workable checklist for the chapter has six parts:
- The research question, and why one data type would leave part of it unanswered.
- The design name, using the typology your supervisor and your reference list share.
- The sequence, the priority and the sample relationship between the strands.
- The integration plan, naming connecting, building, merging or embedding.
- The joint display you will use to report the integrated results.
- The costs you accept. Newcastle University (n.d.) lists increased demands on time and finances and the need for both quantitative and qualitative skills.
If you want a mentor to look at that chapter, thesis and dissertation mentoring from MAAS is advisory: a mentor guides you through the design decisions and gives feedback, while you design the study and write the chapter yourself. For the surrounding sections, see our guides on writing research questions and objectives and writing the methodology. Both fit before or after this decision, and for the qualitative strand, thematic analysis is a common way to produce the themes you will integrate.
Frequently asked questions
What are the three types of mixed methods designs?
Convergent, explanatory sequential and exploratory sequential. Berkovic (n.d.) states that there are three mixed-methods research designs and labels them combine, explain and develop.
Is an embedded design a separate type?
Sometimes. Fetters et al. (2013) treat embedding as a way of integrating, especially in intervention trials, while Berkovic (n.d.) mentions embedded designs as an older term. Ask your supervisor which typology they expect.
Which mixed methods design is easiest for a dissertation?
There is no single answer, and the sources do not rank them. Each has a cost: Berkovic (n.d.) lists unequal sample sizes for convergent and extra planning for both sequential designs.
Can I use the same participants in both phases?
For explanatory sequential, yes: Berkovic (n.d.) says the qualitative sample is usually drawn from the quantitative participants. For exploratory sequential, Berkovic (n.d.) says quantitative participants should not come from the qualitative phase.
What is a joint display?
A figure, table, matrix or graph that brings quantitative and qualitative results together to draw out new insights. Younas and Durante (2023) describe it as a tool for reporting integrated data, findings and meta-inferences.
Does mixed methods take longer?
Usually. Newcastle University (n.d.) lists increased demands on time and finances, and Berkovic (n.d.) calls two-phase designs time-consuming.
References
Berkovic, D. (n.d.). Chapter 11: Mixed-methods research. In Qualitative research: A practical guide for health and social care researchers and practitioners. CAUL OER Collective. https://oercollective.caul.edu.au/qualitative-research/chapter/11/
Bryman, A. (2006). Integrating quantitative and qualitative research: How is it done? Qualitative Research, 6(1), 97–113. https://doi.org/10.1177/1468794106058877
Fetters, M. D., Curry, L. A., & Creswell, J. W. (2013). Achieving integration in mixed methods designs: Principles and practices. Health Services Research, 48(6 Pt 2), 2134–2156. https://doi.org/10.1111/1475-6773.12117
Fetters, M. D., & Tajima, C. (2022). Joint displays of integrated data collection in mixed methods research. International Journal of Qualitative Methods, 21, Article 16094069221104564. https://doi.org/10.1177/16094069221104564
Johnson, R. B., Onwuegbuzie, A. J., & Turner, L. A. (2007). Toward a definition of mixed methods research. Journal of Mixed Methods Research, 1(2), 112–133. https://doi.org/10.1177/1558689806298224
Newcastle University. (n.d.). Mixed methods. Methods Hub. https://research.ncl.ac.uk/methodshub/methods/mixedmethods/
O'Cathain, A., Murphy, E., & Nicholl, J. (2010). Three techniques for integrating data in mixed methods studies. BMJ, 341, Article c4587. https://doi.org/10.1136/bmj.c4587
Younas, A., & Durante, A. (2023). Decision tree for identifying pertinent integration procedures and joint displays in mixed methods research. Journal of Advanced Nursing, 79(7), 2754–2769. https://doi.org/10.1111/jan.15536
Not sure how this guide applies to your own case? Talk it through with MAAS in a free 20-minute consultation.
Book a free consultation ▸