
◆ Research Methods
How do you design a Likert scale questionnaire for a dissertation?
To design a Likert scale questionnaire, write several clear statements for each construct, give every statement the same labelled ordinal response options, and pilot the draft before you collect data. TASO (n.d.) recommends adapting a validated scale where one exists, and it treats five to seven response points as the usual range.
◆ Question 1 / 8 · What is a Likert type questionnaire
What is a Likert type questionnaire, and how is an item different from a scale?
Direct answer: A Likert type questionnaire asks respondents to rate statements on an ordered response format, such as strongly disagree to strongly agree. Sullivan and Artino (2013) describe a typical Likert item as having five or seven ordinal response options. A scale is the set of related items whose responses are combined.
The distinction between an item and a scale matters more than most students expect, because it decides how you write your Methods chapter. A single statement with an agreement format is an item. A scale, in the sense Rensis Likert introduced, is a group of items that all measure the same construct, with each respondent's answers added up or averaged into one score. This explanation of the term is MAAS's own summary of common practice rather than a quotation from the sources below. In a dissertation it means you should be able to name each construct, say which items belong to it, and explain how you will combine them. Sullivan and Artino (2013) make a related point when they say that the way a study handles its data should be justified in the Methods, so decide early whether your items will be analysed one by one or as a combined score.
◆ Question 2 / 8 · What are the 5 Likert points
What are the 5 points in a Likert scale, and can you see some examples?
Direct answer: The most common five points run from strongly disagree through disagree, neither agree nor disagree and agree to strongly agree. Sullivan and Artino (2013) describe five or seven options as typical. The label set can change with the construct, for example frequency or quality instead of agreement.
The agreement version is the one most students meet first, and the table below shows it with one example item. The item is our own illustration for a study of student wellbeing, not taken from a published instrument, so treat it as a pattern for your own wording.
| Point | Label | Example item: "I feel comfortable asking my tutor for help." |
|---|---|---|
| 1 | Strongly disagree | Very far from my experience |
| 2 | Disagree | Mostly not my experience |
| 3 | Neither agree nor disagree | Neutral or unsure |
| 4 | Agree | Mostly my experience |
| 5 | Strongly agree | Very much my experience |
Each respondent ticks one point per item, and the same five labels repeat down the whole questionnaire. That consistency is deliberate. TASO (n.d.) advises labelling every point on the scale rather than only the two ends, which removes guesswork about what a "3" or a "4" means. If you change construct, for example from agreement to satisfaction or frequency, change the labels to match, and keep the same number of points so the items can be compared.
◆ Question 3 / 8 · 5-point or 7-point scale
Is a 5-point or a 7-point Likert scale better?
Direct answer: Neither is better in every case. Aybek and Toraman (2022) recommend five points, while Höhne et al. (2023) found seven-point scales had higher composite reliabilities. TASO (n.d.), drawing on Weijters and colleagues, suggests five points for a general population and seven for respondents with high verbal skills.
Aybek and Toraman (2022) asked 153 participants to answer 3-, 5- and 7-point forms of the same scale. McDonald's omega was .852 for the three-point form, .906 for the five-point form and .900 for the seven-point form. They also found that in the seven-point form only four to five categories were actually differentiated, which is why they recommend five points. Höhne et al. (2023) studied 4,676 respondents in the German Internet Panel and found five-point scales were more robust against scale direction effects, whereas seven-point scales had higher composite reliabilities. The two findings pull in slightly different directions, so the table below sets them side by side.
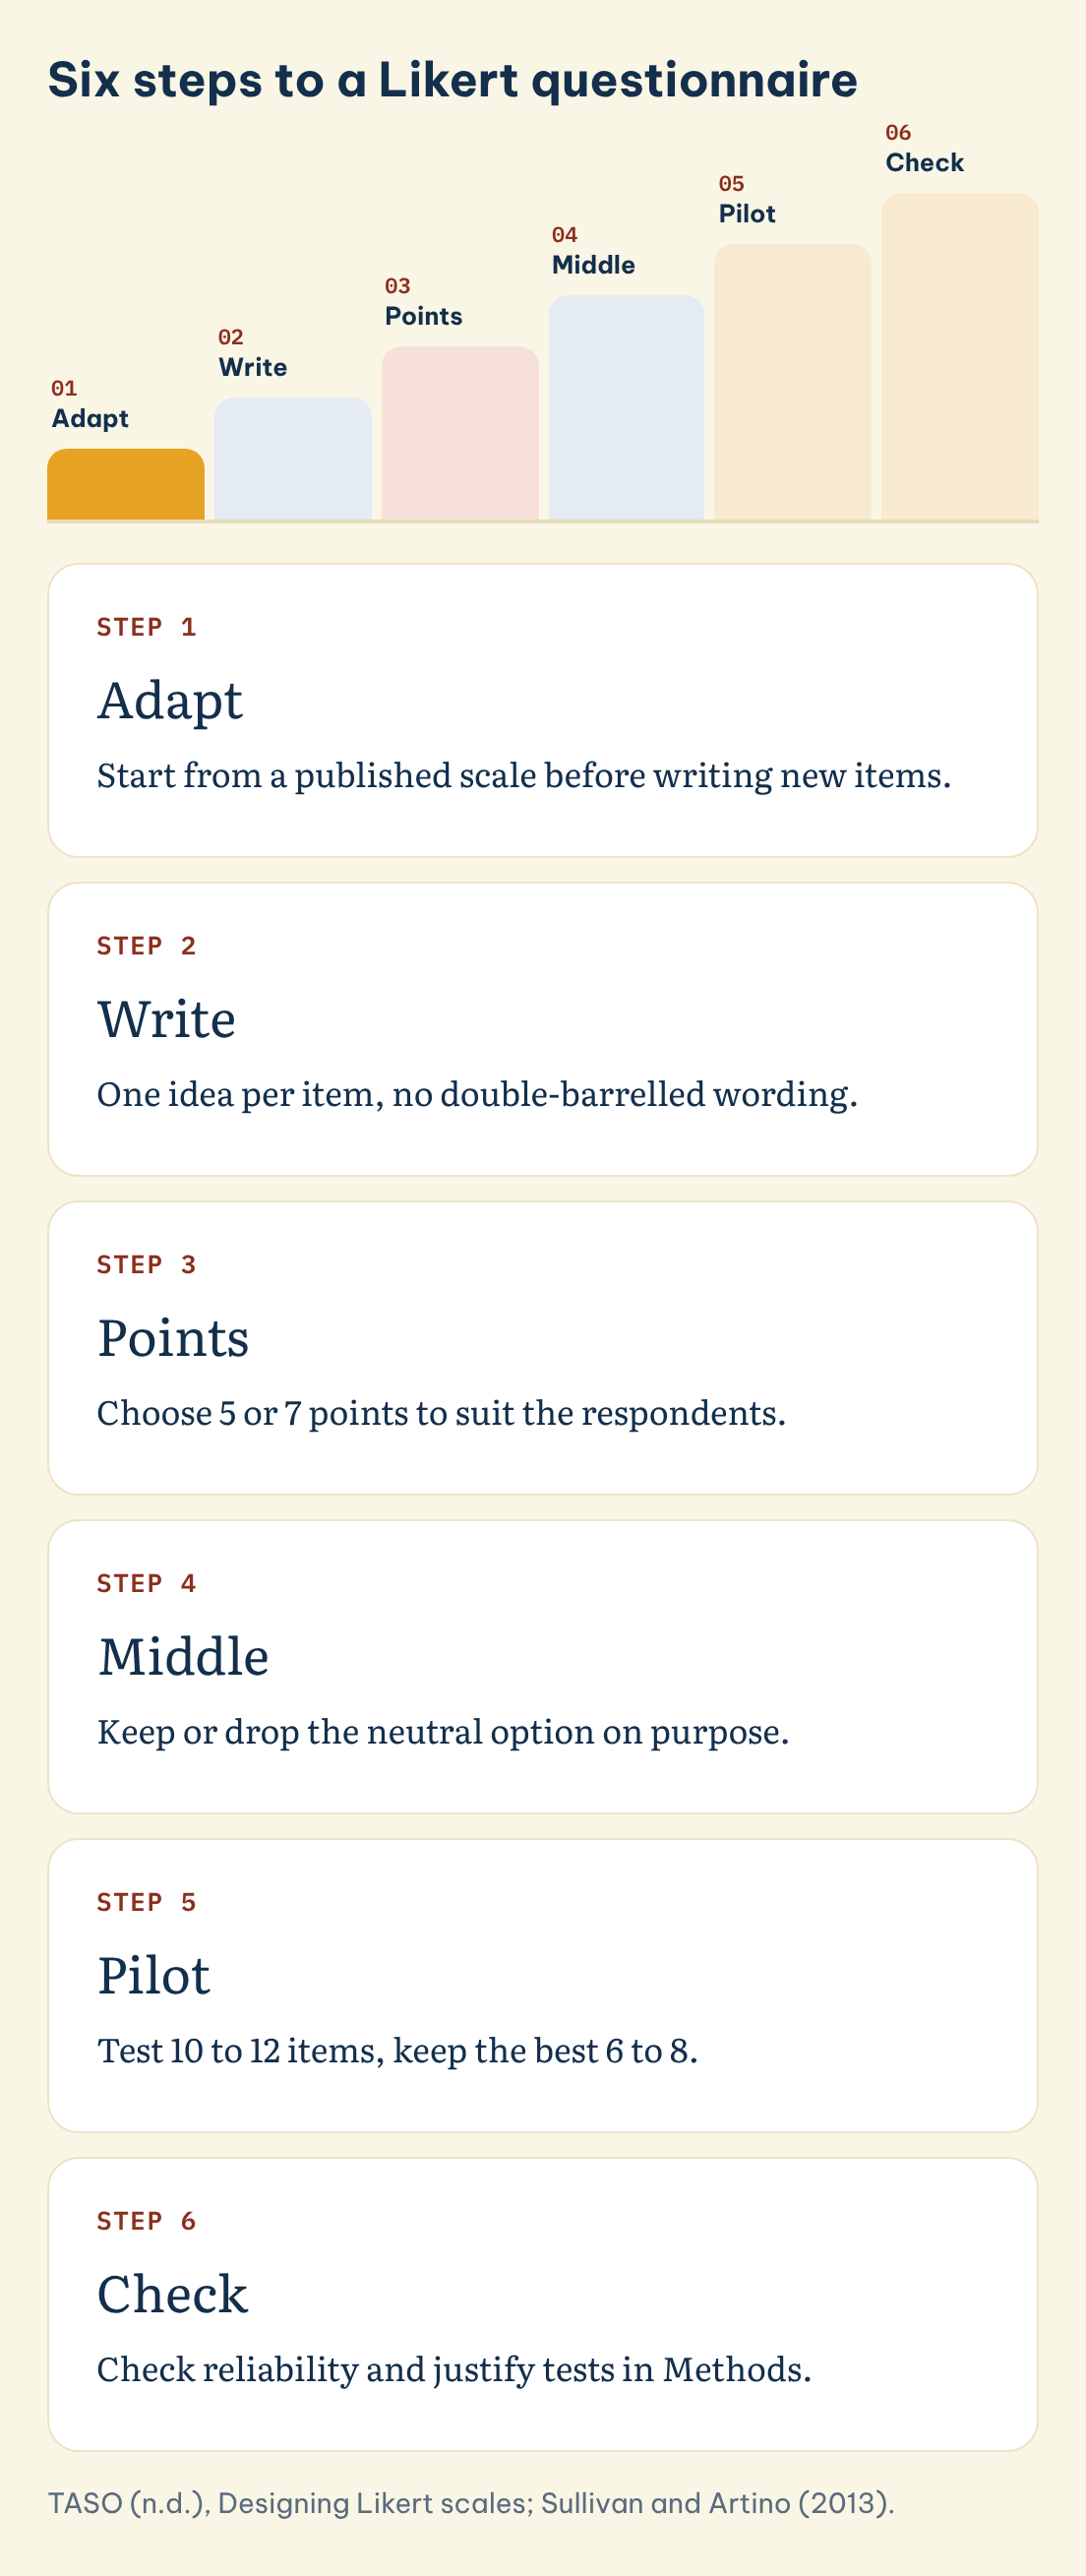
Six steps to a Likert questionnaire
Design order drawn from the TASO guidance used in this post.
Step 1
Adapt
Start from a published scale before writing new items.
Step 2
Write
One idea per item, no double-barrelled wording.
Step 3
Points
Choose 5 or 7 points to suit the respondents.
Step 4
Middle
Keep or drop the neutral option on purpose.
Step 5
Pilot
Test 10 to 12 items, keep the best 6 to 8.
Step 6
Check
Check reliability and justify tests in Methods.
Save this figure
| 5-point scale | 7-point scale | |
|---|---|---|
| Aybek and Toraman (2022), omega | .906 | .900 |
| Aybek and Toraman (2022), categories used | Recommended | Only 4 to 5 differentiated |
| Höhne et al. (2023) | More robust against direction effects | Higher composite reliabilities |
| TASO (n.d.), citing Weijters and colleagues | General population | High verbal skills |
For a dissertation with adult participants, five points is a defensible default, and your Methods chapter should say which of these sources you followed and why.
◆ Question 4 / 8 · Midpoint and 4-point scales
Should you include a midpoint, and what about a 4-point Likert scale?
Direct answer: Include a midpoint when respondents know the topic well or when you want to treat the scale as interval. Leave it out when they are unfamiliar with the topic or may not have formed an opinion. TASO (n.d.) draws this advice from Chyung et al. (2017).
TASO (n.d.), summarising Chyung et al. (2017), lists reasons to omit a midpoint: respondents who are unfamiliar with the topic, who have no formed opinion, who may answer in a socially desirable way, or who may put in low effort. A scale without a midpoint has an even number of points, which is what people mean by a four-point Likert scale. It forces a lean towards one side, so it suits topics where you expect respondents to have a view. TASO (n.d.) also notes that four points can suit young learners, citing Nemoto and Beglar. The risk of forcing a choice is that someone with no opinion picks a side at random, which adds noise to your data. If you are unsure, pilot both formats on a handful of people and see where they hesitate. Whatever you choose, record the reason, because a supervisor or examiner is likely to ask.
◆ Question 5 / 8 · How to write good items
How do you write good Likert items?
Direct answer: Write one idea per statement, keep the wording easy, label every point and prefer item-specific labels to a generic agree scale. TASO (n.d.) also advises avoiding negatively worded items and balancing the questionnaire against acquiescence bias, the habit of agreeing whatever the statement says.
TASO (n.d.) lists several rules that you can apply item by item. Avoid double-barrelled items, which ask about two things at once. "The lectures are clear and well paced" is a poor item, because a respondent who finds them clear but too fast cannot answer honestly, so split it into two. Keep items easy to understand and test them with cognitive interviewing, which means asking a few people to explain in their own words what each item means. TASO (n.d.) says item-specific labels are preferable, so "How clear are the lectures? Very unclear to very clear" is better than "The lectures are clear: strongly disagree to strongly agree". It also recommends avoiding negatively worded items, so write "I find the feedback useful" rather than "I do not find the feedback useful". To balance acquiescence bias, TASO (n.d.) suggests alternating the direction of the response options every few items, and item-specific labels are another way to reduce it.
◆ Question 6 / 8 · How many items, which scale
How many items do you need, and should you adapt an existing scale?
Direct answer: Start from a published, validated scale whenever your construct already has one, because it arrives with reliability evidence. When you must write new items, draft more than you need, test them on a small group, and cut the weakest before the main study begins.
Adapting an existing scale saves time and gives you reliability evidence from earlier research, which is why TASO (n.d.) puts it first among its guidelines. If you do adapt, say in your Methods which scale you started from and exactly what you changed, since changed wording is no longer the same instrument. If no suitable scale exists, you will have to write your own items. In that case the figures from TASO (n.d.) are the only guide we found: start with 10 to 12 items for a construct and keep the 6 to 8 that perform best, or plan about 5 items per construct for other cases. Your pilot is where you find out which items to cut. Ask pilot participants where they were confused, check that answers are not all piled onto one option, and revise before the main study opens. A short pilot is usually easier to fit into a dissertation timeline than a full redesign after data collection.
◆ Question 7 / 8 · How to analyse Likert data
How do you analyse Likert scale data?
Direct answer: Pick a test that fits how you treat the responses, ordinal or interval, and say why in your Methods. A widely cited medical education editorial accepts t-tests and ANOVA on multi-item scale scores, so the bigger risk is leaving the choice unexplained. Add a reliability figure for each combined scale.
Responses to a single item are ordinal, because the gaps between "agree" and "strongly agree" are not guaranteed to be equal. That is the reason some researchers prefer non-parametric tests. Norman (2010) argues the opposite, that parametric statistics are robust for Likert data, and Sullivan and Artino (2013) reach a similar position for scales made of several items. Neither source says the debate is closed, so the safest approach is to state your choice and the reason in the Methods chapter, as Sullivan and Artino (2013) recommend. Sullivan and Artino (2013) also point to Cronbach alpha and factor analysis as evidence of reliability for a combined scale. In practice, report an alpha for each scale you build from several items, and be clear in your write-up about whether a result refers to a single item or to a combined score. If your department publishes a preferred approach, follow it and cite it.
◆ Question 8 / 8 · How MAAS can help
How can MAAS help with your questionnaire design?
Direct answer: MAAS works as an advisor. A mentor reviews your item wording, response options and pilot plan, explains what to change and why, and leaves the decisions about your study with you. Work is quoted by scope, and no grade or result is promised.
If you are unsure whether your items measure what you intend, research and data collection support from MAAS runs in three stages: the instrument first, then fieldwork, then cleaning. A mentor can read your draft items, point out double-barrelled wording, check that your response labels are consistent and help you explain your analysis choice in the Methods. Most students begin by sending their research questions and a first set of items, so the mentor can see the constructs before commenting on wording.
Frequently asked questions
What is the 7 Likert scale?
It is a response format with seven ordered options, usually running from strongly disagree to strongly agree with a midpoint. Sullivan and Artino (2013) describe five or seven options as typical for a Likert item.
Is a 5-point or 7-point Likert scale better?
It depends on your sample. Aybek and Toraman (2022) recommend five points, and Höhne et al. (2023) found higher composite reliabilities for seven points. TASO (n.d.) suggests seven for respondents with high verbal skills.
What is a 4-point Likert scale?
It is a scale with no midpoint, so respondents must lean one way. TASO (n.d.) says to omit the midpoint when respondents are unfamiliar with the topic or have no formed opinion, citing Chyung et al. (2017).
How many Likert items do I need?
TASO (n.d.) suggests piloting 10 to 12 items and keeping the best 6 to 8, citing Nemoto and Beglar, or using about 5 items per construct.
Can I use parametric tests on Likert data?
Sullivan and Artino (2013) say that "parametric tests can be used to analyze Likert scale responses" (p. 542), and Norman (2010) argues they are robust. State and justify your choice in the Methods.
Should I label every point on the scale?
Yes. TASO (n.d.) advises labelling every point, and says item-specific labels are preferable to a generic agreement scale.
References
Aybek, E. C., & Toraman, C. (2022). How many response categories are sufficient for Likert type scales? An empirical study based on the Item Response Theory. International Journal of Assessment Tools in Education, 9(2), 534–547. https://doi.org/10.21449/ijate.1132931
Chyung, S. Y., Roberts, K., Swanson, I., & Hankinson, A. (2017). Evidence-based survey design: The use of a midpoint on the Likert scale. Performance Improvement, 56(10), 15–23. https://doi.org/10.1002/pfi.21727
Höhne, J. K., Krebs, D., & Kühnel, S. M. (2023). Investigating direction effects in rating scales with five and seven points in a probability-based online panel. Survey Research Methods, 17(2), 193–204. https://doi.org/10.18148/srm/2023.v17i2.8006
Norman, G. (2010). Likert scales, levels of measurement and the "laws" of statistics. Advances in Health Sciences Education, 15(5), 625–632. https://doi.org/10.1007/s10459-010-9222-y
Sullivan, G. M., & Artino, A. R., Jr. (2013). Analyzing and interpreting data from Likert-type scales. Journal of Graduate Medical Education, 5(4), 541–542. https://doi.org/10.4300/JGME-5-4-18
TASO. (n.d.). Designing Likert scales. Transforming Access and Student Outcomes in Higher Education. https://taso.org.uk/libraryitem/designing-likert-scales/
Not sure how this guide applies to your own case? Talk it through with MAAS in a free 20-minute consultation.
Book a free consultation ▸