
ISYS3453, and its companion code ISYS3454, Data Analytics rewards students who turn a business question into an analysis and explain what the result means, not those who simply produce charts. Most students who struggle with this RMIT course are not short on technical effort: they clean the data, run the model, and paste the output, but never state the question the analysis answers. This guide answers the seven questions Vietnamese students at RMIT ask MAAS mentors most often.
Author: MAAS Editorial Team
Last updated: 2026-07-20
Category: it-data

What is ISYS3453 / ISYS3454 Data Analytics about?
Direct answer: ISYS3453 is an RMIT information-systems course (ISYS3454 is the parallel code for a different cohort) about using data to support business decisions. It covers framing a business problem as an analytics question, data acquisition, cleaning, exploratory analysis, predictive techniques such as regression and classification, and communicating findings to a non-technical audience. The course assesses business reasoning, not analysis alone.
Evidence: The teaching frame follows the standard analytics process taught across the discipline, the CRISP-DM cycle from business understanding through data preparation, modelling, and evaluation to deployment and the descriptive-diagnostic-predictive-prescriptive hierarchy used by Provost and Fawcett to distinguish what a technique can and cannot tell you.
Example: A Vietnamese student at RMIT Vietnam arrived at MAAS with a notebook of twelve charts and a conclusion that "sales vary by region". Her mentor asked what decision the analysis was for. Once the report was rebuilt around a single question, which region to prioritise for next quarter's spend, and what the data does and does not justify, nine charts were cut and her mark moved from a Pass-level draft to a Distinction.
What assessment does the ISYS3453 assignment usually involve?
Direct answer: Analytics courses at this level are commonly assessed through a staged individual project on a supplied or chosen dataset, often data preparation and exploration first, then modelling, then a business-facing report or presentation, sometimes with a group component and a reflective piece.
You are typically asked to submit both your analysis artefacts, such as a notebook or workbook, and a written report interpreting the findings for a decision maker. Always confirm the exact task, tools, word count, and weighting in your own Canvas shell, because assessment structure changes by semester, code (ISYS3453 vs ISYS3454), and campus.
Evidence: RMIT business and IS assessments are criterion-referenced, meaning marks are awarded against published rubric criteria rather than ranked against classmates. This is set out in RMIT's Assessment policy, which is why decoding the rubric matters far more than how many techniques you demonstrate.
Example: A Vietnamese RMIT student spent most of a report documenting every cleaning step he performed. His MAAS mentor moved the step-by-step log to an appendix and kept only the decisions that changed the result, how missing values were handled and why, reallocating the words to interpretation. Same analysis, same word count, a clear Distinction.
How is the ISYS3453 assignment graded, what does the rubric actually reward?
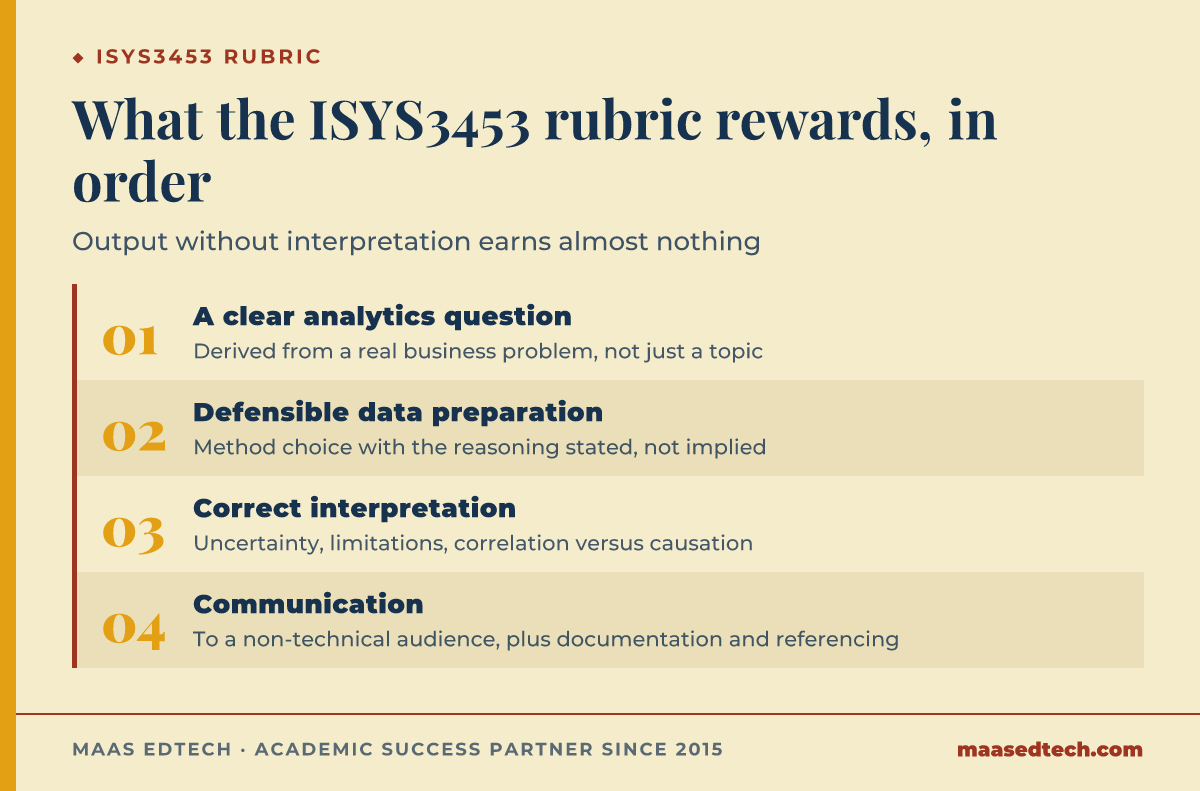
Direct answer: Analytics rubrics at this level reward four things, roughly in this order: (1) a clear analytics question derived from a business problem, (2) defensible data preparation and method choice, with the reasoning stated rather than implied, (3) correct interpretation including uncertainty, limitations, and the difference between correlation and causation, and (4) communication to a non-technical audience plus documentation and referencing. Output without interpretation earns almost nothing: a model with a good accuracy score and no explanation of what it changes is the classic Credit-level submission.
Evidence: Criterion bands run Pass / Credit / Distinction / High Distinction, and the jump from Credit to Distinction is usually defined by "critical" and "justified", justified method choices and critically interpreted results, not by using a more advanced algorithm.
Example: A MAAS mentor marked one Vietnamese student's draft by asking a single question of each figure: what decision does this change? Seven of ten charts had no answer. After the cull and a rewrite of the remaining three with interpretation underneath each, the same analysis moved up two full rubric bands.
Which frameworks and techniques should you use in ISYS3453?
Direct answer: Structure the work with a process framework and keep the techniques proportionate to the question. Use CRISP-DM to organise the project and to justify why you did each step; the analytics hierarchy to be explicit about whether you are describing, diagnosing, predicting, or prescribing; a documented data-quality assessment covering missingness, outliers, and consistency; a model-evaluation approach appropriate to the task, including a train-test split and metrics beyond accuracy where classes are imbalanced; and a visualisation principle set so each chart makes one point. A simple, well-interpreted model almost always outscores a complex, unexplained one.
| Framework / step | What it gives you | Use it to decide |
|---|---|---|
| CRISP-DM cycle | A defensible project structure from business question to evaluation | What to do next, and how to justify each step in the report |
| Analytics hierarchy (descriptive → prescriptive) | What class of claim your technique can support | Whether you may say "is associated with" or "will cause" |
| Data-quality assessment | Missingness, outliers, duplicates, and consistency issues | How to treat problem records, and what to disclose |
| Model evaluation (train-test, precision, recall) | How well the model performs on data it has not seen | Whether the result is trustworthy enough to act on |
| One-point-per-chart visualisation | Which comparison the reader should take away | Which figures to keep and which to cut |
Evidence: These frameworks are examiner-recognised foundations: Provost and Fawcett (2013) for the data-science-for-business framing, Wickham, Çetinkaya-Rundel and Grolemund (2023) for the tidy analysis workflow, Chatfield (1995) for the problem-formulation-first principle in applied statistics, and Kelleher, Mac Namee and D'Arcy (2020) if your brief runs to a full predictive model rather than descriptive analysis. Note the standard caution, observational business data supports association, not causation, unless the design justifies more. Shmueli (2010) formalises this as the difference between explanatory and predictive modelling, warning that "conflation between explanation and prediction is common, yet the distinction must be understood for progressing scientific knowledge" (Shmueli, 2010, p. 289), and naming that distinction in your report is a Distinction-level move.
Example: A Vietnamese RMIT student ran three algorithms and reported the highest accuracy without noticing that 94% of his cases were one class. His MAAS mentor introduced precision and recall, which showed the model never predicted the minority class at all. Naming that failure earned more marks than the original headline number.
How should you structure the ISYS3453 report?
Direct answer: Use a decision-led structure: (1) the business problem and the analytics question it becomes, (2) the data and its preparation, with only the decisions that affected the result in the body and the full log in an appendix, (3) the method and why it fits the question, (4) results interpreted in business terms with uncertainty stated, and (5) recommendations, limitations, and next steps. Every figure needs a caption and a sentence saying what it means. Put code, full outputs, and detailed cleaning steps in appendices, the body is for reasoning.
Evidence: Criterion-referenced rubrics weight "interpretation", "justification of method", and "communication" far above "volume of analysis". Matching your word budget to the rubric weighting is the most reliable way to lift a grade without running more models.
Example: A Vietnamese RMIT student submitted a report that was 70% method documentation and ended with "further research is recommended". His MAAS mentor replaced the closing with three specific, data-supported actions and the conditions under which each would fail. Same analysis, the report moved from a borderline Credit to a Distinction.
What are the most common mistakes that lose marks in ISYS3453?
Direct answer: Three recurring mistakes show up across MAAS analytics coaching. First, chart dumping, many visualisations, no argument, and no statement of which comparison matters. Second, causal language on correlational evidence: "increasing ad spend raises retention" from observational data with no design that could support it. Third, undisclosed data decisions, rows dropped, outliers removed, or categories merged without a word in the report, which markers treat as a transparency failure rather than a technical one. Fixing these three lifts most drafts by at least one rubric band.
Evidence: Across MAAS analytics coaching, marker feedback before intervention clusters heavily on "results not interpreted" and "limitations not addressed", the two phrases that most often separate a Credit from a Distinction in analytics rubrics.
Example: A Vietnamese student concluded that a promotion "caused" a sales lift. His MAAS mentor pointed out the promotion ran in December. The revised report named seasonality as a competing explanation, showed the prior year's December, and stated what data would be needed to separate the two, earning full marks on the criterion the causal claim had failed.
How long is the ISYS3453 assignment and what referencing style does it use?
Direct answer: Confirm the exact word count, submission format, and style in your assessment brief, analytics reports at this level commonly sit between 1,500 and 2,500 words for the written component, with appendices, code, and reference lists usually excluded, and RMIT business programs default to Harvard referencing. Cite your data source with its provider, date, and any licence conditions, and cite the packages or tools you used for the analysis, because reproducibility is part of good analytics practice and some rubrics mark it explicitly.
Evidence: RMIT's Business school uses RMIT Harvard as its standard referencing style, documented in RMIT's Easy Cite referencing tool. Markers routinely deduct marks for unreferenced datasets, uncited methods, or a notebook that cannot be run from the submitted files.
Example: A Vietnamese RMIT student lost marks because his dataset had no source citation and his notebook referenced a local file path no marker could access. A MAAS pre-submission audit fixed both in under an hour, data properly cited and paths made relative. On his next task, clean documentation recovered marks on a criterion requiring no extra analysis.
Frequently asked questions
Is ISYS3453 a hard course?
It is demanding in two directions at once: enough technical skill to prepare and model data, and enough business judgement to say what the result means. Students who focus only on the tooling struggle; students who keep asking "what decision does this support" do well.
What is the difference between ISYS3453 and ISYS3454?
They are parallel course codes for substantially the same Data Analytics content, used across different cohorts, programs, or campus offerings. The analytics you need is the same; the brief, tools, weighting, and due dates can differ, so always work from the brief in your own Canvas shell.
Do I need to know Python or R?
It depends on the brief, some offerings use Python or R, others use Excel, Power BI, or Tableau. Whichever the tool, the marks come from framing, interpretation, and communication rather than from code elegance, so prioritise a defensible simple analysis over an impressive unexplained one.
Can I choose my own dataset?
Often yes, within the brief's constraints. Choose one with enough records and enough variation to answer a real question, check the licence permits academic use, and confirm it contains no personal data you are not permitted to process.
What referencing style does ISYS3453 use?
RMIT Harvard is the default for business programs, and it applies to datasets, tools, and packages as well as literature. Confirm in your own brief and use RMIT's Easy Cite tool for consistency.
Can MAAS help me with ISYS3453?
Yes. MAAS Assignment & Essay Support coaches you through the assignment with the Outline, Draft, Final model, sharpening the analytics question, checking method choices, interpreting results honestly, and a pre-submission documentation audit, all with discipline-matched experts. Data & Coding Projects supports the quantitative side. We coach your work; we do not write it for you.
Ready to approach ISYS3453 with a clear strategy?
If you have the output but not the argument, that is exactly where a discipline-matched expert helps most. MAAS Assignment & Essay Support is an academic support partner; we work alongside you through Outline, Draft, Final so the analysis stays yours and the structure earns the marks.
Bring your ISYS3453 or ISYS3454 brief and we will match you to a data analytics mentor, 23% of our 100+ experts hold a PhD, within 48 hours when our network already covers that field. If it does not, MAAS opens a dedicated recruitment round for your case, which usually takes about two weeks.
Book a free 15-minute ISYS3453 consultation with MAAS Assignment & Essay Support →
Related guides
- How to write a methodology in an essay: for justifying method choices in any data-led report
- How to approach the MGK3201 Big Data and Marketing Analytics assignment?: the marketing-side companion to this course
- Choosing the right statistical test: for matching a test to your question and data type
- Data & Coding Projects service: support with data analysis, charts, and quantitative tasks
- Course-code assignment coaching: pillar guide on tackling any unit assignment with a MAAS mentor
References
- Chatfield, C. (1995). Problem solving: A statistician's guide (2nd ed.). Chapman & Hall.
- Kelleher, J. D., Mac Namee, B., & D'Arcy, A. (2020). Fundamentals of machine learning for predictive data analytics (2nd ed.). MIT Press.
- Provost, F., & Fawcett, T. (2013). Data science for business: What you need to know about data mining and data-analytic thinking. O'Reilly Media.
- Shmueli, G. (2010). To explain or to predict? Statistical Science, 25(3), 289–310. https://doi.org/10.1214/10-STS330
- Wickham, H., Çetinkaya-Rundel, M., & Grolemund, G. (2023). R for data science (2nd ed.). O'Reilly Media.
Tools & resources
- RMIT University. (n.d.). Assessment and exams. Retrieved July 20, 2026, from https://www.rmit.edu.au/students/student-essentials/assessment-and-exams
- RMIT University. (n.d.). Easy Cite referencing tool. Retrieved July 20, 2026, from https://www.rmit.edu.au/library/study/referencing
This article is part of the MAAS Journal series for Vietnamese international students. MAAS Assignment & Essay Support is an academic support partner; we coach students through the Outline, Draft, Final delivery model with developmental feedback from discipline-matched experts. We do not write or submit work on a student's behalf.