
◆ Research Methods
What is the Wilcoxon signed-rank test and when should you use it?
The Wilcoxon signed-rank test compares two related sets of scores, such as before and after measurements on the same people, by ranking the size of their differences. Fiel Peres (2026) describes it for dependent groups. It is the usual alternative when a paired t-test is not appropriate, and this guide walks through assumptions, ranking, output, effect size and reporting.
◆ Question 1 / 10 · Used for
What is a Wilcoxon signed-rank test used for?
Direct answer: It tests whether two related sets of scores differ, using the ranks of the paired differences instead of the raw values. Fiel Peres (2026) says it suits two dependent groups, such as before and after an intervention. SciPy (n.d.) calls it the non-parametric version of the paired t-test.
The test works on pairs. Each participant, or each matched unit, gives you two scores, and the test asks whether the differences between those scores are centred on zero. R Core Team (n.d.) phrases the null hypothesis as the distribution of the paired differences being symmetric about a chosen value, which is zero in the usual case. Wilcoxon (1945) introduced the idea as a way "to indicate the possibility of using ranking methods" to get a rapid approximate idea of the significance of differences in paired experiments (p. 80).
Typical dissertation uses include a pre-test and post-test score for the same group, two ratings of the same students under two conditions, or a measurement taken twice on the same patients. If you only have one score per person and two separate groups, you need a different test, which is covered below. For a wider map of which test fits which design, see our guide on choosing the right statistical test.
◆ Question 2 / 10 · Vs t-test
Why use Wilcoxon instead of a t-test?
Direct answer: Use it when the paired t-test's conditions look doubtful, for example when the differences are clearly non-normal or the scores are ordinal. Laerd Statistics (2018) states that the test does not assume normality in the data, so it fits when the dependent t-test is inappropriate.
The parametric equivalent is the paired-samples t-test, which works on the mean of the differences. The Wilcoxon test works on the ranks of the differences, so one extreme value affects it less than it affects a mean. The cost of that robustness is that you interpret a shift in the ranks of the differences rather than a mean difference in the original units.
Be careful with ordinal data. Fiel Peres (2026) notes that applying the test to ordinal data requires assumptions that are frequently unrealistic, namely that differences between pairs of scores can be meaningfully ranked and that the scale intervals are consistent. A five-point Likert item is the standard case where you should ask yourself whether a change from 1 to 2 means the same as a change from 4 to 5. Write your answer to that question into your methodology chapter. If you are unsure which route to take, our guide to thesis statistics help shows where this decision usually sits in a dissertation.
◆ Question 3 / 10 · Vs Mann-Whitney
What is the difference between Mann-Whitney and Wilcoxon?
Direct answer: The signed-rank test is for paired data and the Mann-Whitney U test is for two independent groups. Kerby (2014) writes that the U test compares two independent groups, while the signed-rank test compares two matched groups. R's wilcox.test covers both through its paired argument.
The confusion comes from naming. R Core Team (n.d.) documents a single function, wilcox.test, which performs a signed rank test when paired is TRUE and a rank sum test, described as equivalent to the Mann-Whitney test, when paired is FALSE. So "Wilcoxon" can mean either test depending on who is writing, and you should name the test by its design in your own work.
A quick way to decide is to ask whether each score in one group has a natural partner in the other. The same person measured twice has a partner. Two different classes taking the same exam do not. The table sets out the three tests that students most often confuse.
| Situation | Parametric test | Rank-based test |
|---|---|---|
| Two related sets of scores (same people twice, matched pairs) | Paired-samples t-test | Wilcoxon signed-rank test |
| Two independent groups | Independent-samples t-test | Mann-Whitney U test |
| Three or more related sets of scores | Repeated-measures ANOVA | Friedman test |
The Friedman row follows GraphPad Software (n.d.), which points to the Friedman test for three or more matched groups. The ANOVA pairing is the standard parametric counterpart and is added here for orientation.
◆ Question 4 / 10 · Assumptions
When should you use the Wilcoxon test, and what does it assume?
Direct answer: Use it for paired scores at the ordinal or continuous level when you cannot rely on normal differences. Laerd Statistics (2018) lists three assumptions: an ordinal or continuous outcome, related groups or matched pairs, and a roughly symmetric distribution of the differences.
GraphPad Software (n.d.) adds a point that is easy to miss. The test does not assume the differences are Gaussian, but it does assume they are distributed symmetrically around their median. A strongly skewed set of differences breaks this assumption, and a histogram of the differences is the quickest check. GraphPad Software (n.d.) also asks whether the pairs are independent of each other, meaning that one participant's pair should not influence another's.
A short checklist you can put in a methods section:
- The outcome is ordinal or continuous, and you have justified treating it that way.
- Each score belongs to a pair, from the same participant or a deliberately matched unit.
- The pairs are independent of one another.
- You have looked at the distribution of the differences and judged it roughly symmetric.
If the symmetry check fails badly, say so and explain what you did instead. Wilcoxon (1945) also noted a link to the sign test, which uses only the direction of each difference, and argued that his method uses the magnitudes as well and so "should have higher efficiency" (p. 81).
◆ Question 5 / 10 · Ranking
How does the ranking work, step by step?
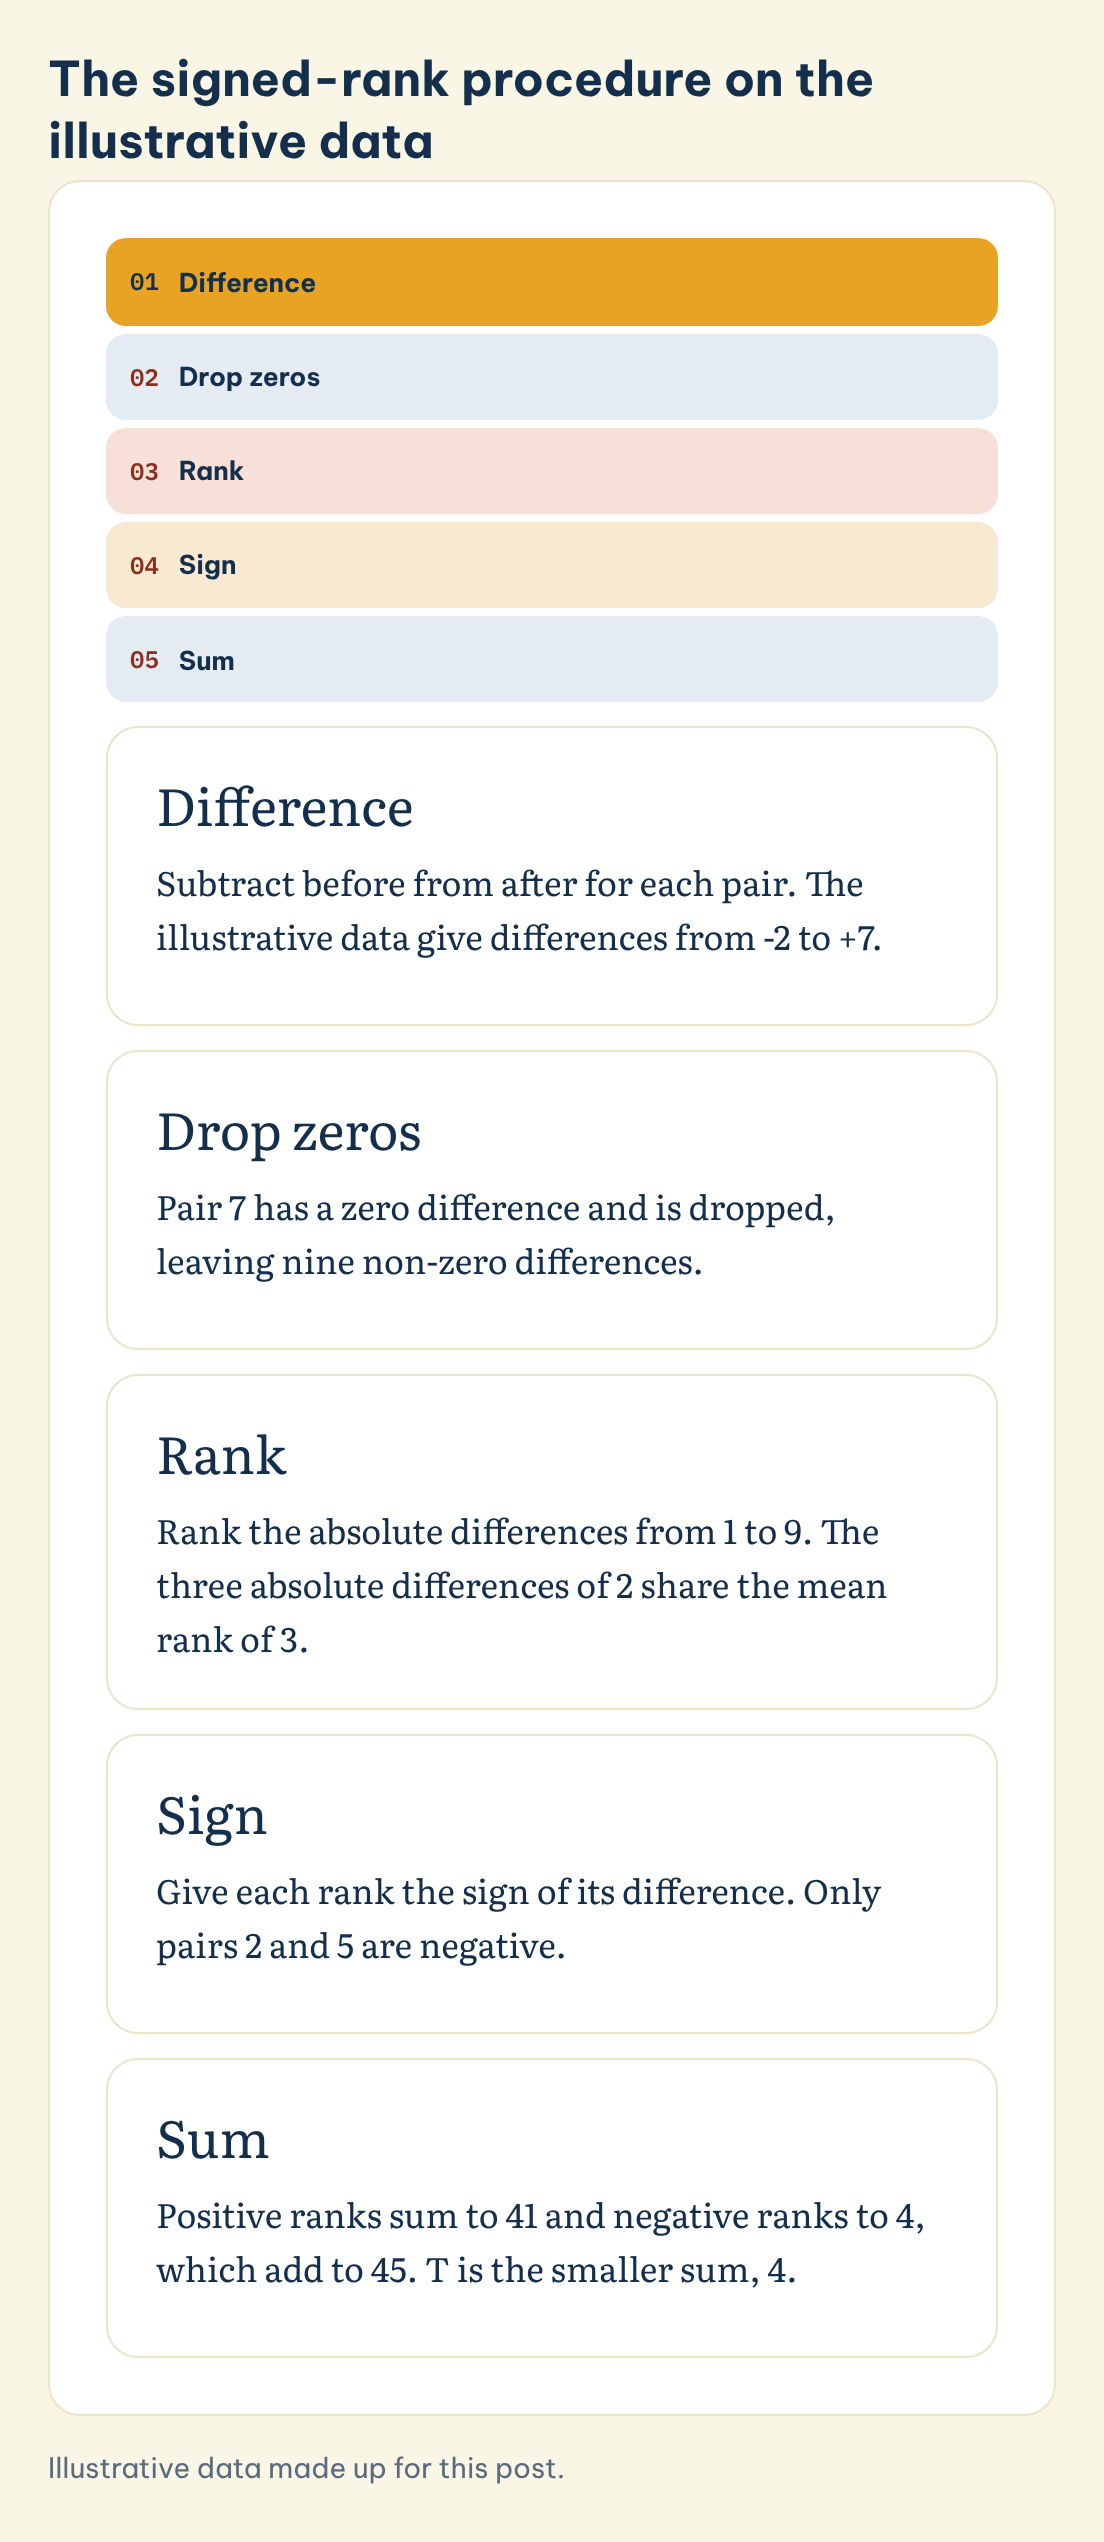
Direct answer: Find each pair's difference, drop zeros, rank the absolute differences from smallest to largest, give tied values their mean rank, attach the sign of each difference to its rank, and sum the positive and negative ranks. Wilcoxon (1945, p. 81) describes the ranking of differences "in order of magnitude neglecting signs".
The signed-rank procedure on the illustrative data
Tap a step to see what happens to the ten made-up pairs.
Difference
Subtract before from after for each pair. The illustrative data give differences from -2 to +7.
Drop zeros
Pair 7 has a zero difference and is dropped, leaving nine non-zero differences.
Rank
Rank the absolute differences from 1 to 9. The three absolute differences of 2 share the mean rank of 3.
Sign
Give each rank the sign of its difference. Only pairs 2 and 5 are negative.
Sum
Positive ranks sum to 41 and negative ranks to 4, which add to 45. T is the smaller sum, 4.
Save this figure
The wording in the original paper is worth quoting, because it fixes the order of operations: "rank numbers are assigned to the differences in order of magnitude neglecting signs, and then those rank numbers which correspond to negative differences receive a negative sign" (Wilcoxon, 1945, p. 81). Ties receive the mean of the ranks they occupy, a rule Wilcoxon (1945, p. 80) states for tied values in his unpaired example, and the same rule is applied in practice to tied absolute differences.
The numbers below are made up for illustration only, and they come from no real study. Ten participants gave a score before and after a short workshop, and the table follows the five steps.
| Pair | Before | After | Difference | Absolute difference | Rank | Signed rank |
|---|---|---|---|---|---|---|
| 1 | 12 | 16 | +4 | 4 | 6 | +6 |
| 2 | 15 | 14 | -1 | 1 | 1 | -1 |
| 3 | 10 | 16 | +6 | 6 | 8 | +8 |
| 4 | 14 | 16 | +2 | 2 | 3 | +3 |
| 5 | 13 | 11 | -2 | 2 | 3 | -3 |
| 6 | 9 | 14 | +5 | 5 | 7 | +7 |
| 7 | 11 | 11 | 0 | 0 | dropped | dropped |
| 8 | 16 | 19 | +3 | 3 | 5 | +5 |
| 9 | 8 | 15 | +7 | 7 | 9 | +9 |
| 10 | 12 | 14 | +2 | 2 | 3 | +3 |
Pair 7 has a zero difference and is dropped. That leaves nine non-zero differences, and the three absolute differences of 2 occupy ranks 2, 3 and 4, so each receives the mean rank of 3. The positive ranks sum to 6 + 8 + 3 + 7 + 5 + 9 + 3 = 41, and the negative ranks sum to 1 + 3 = 4. As a check, the two sums add to 45, which equals 9 x 10 / 2, the total of ranks 1 to 9.
◆ Question 6 / 10 · Formula
What is the Wilcoxon signed-rank test formula?
Direct answer: The test statistic T is the smaller of the positive and negative rank sums. Fiel Peres (2026) gives z = (T - n(n+1)/4) / sqrt(n(n+1)(2n+1)/24), where n is the number of non-zero differences. That formula includes no continuity correction or tie adjustment.
In the worked example T = 4 and n = 9. The mean under the null hypothesis is 9 x 10 / 4 = 22.5, and the standard deviation is the square root of 9 x 10 x 19 / 24, which is about 8.44. That gives z = (4 - 22.5) / 8.44, or about -2.19. This is a hand calculation with the simple formula, so it is not what your software will print exactly.
Software differs in three ways, and each matters for what you report. SciPy (n.d.) reports the sum of the ranks of the differences above or below zero, whichever is smaller, and offers an optional continuity correction that shifts the statistic by 0.5 towards the mean. R Core Team (n.d.) computes an exact p-value by default when there are fewer than 50 finite values and otherwise uses a normal approximation, and with ties it uses the conditional distribution given the observed ranks. GraphPad Software (n.d.) states that Prism calculates an exact P value when there are fewer than 200 pairs. In short, a hand z and a software p-value can legitimately disagree slightly, and settings for ties and zeros change the result. State the software and its settings in your methods section.
◆ Question 7 / 10 · Zeros and ties
How are zeros and ties handled?
Direct answer: Zero differences are a software choice, not a universal rule. SciPy (n.d.) offers three zero methods: wilcox discards them (the default), pratt ranks them and then drops their ranks, and zsplit splits the zero rank between the signs. Tied absolute differences get their mean rank.
GraphPad Software (n.d.) explains the history. When Wilcoxon developed the test he recommended that zero differences simply be ignored. Pratt later proposed a different method, and Prism 6 and later let you choose. GraphPad Software (n.d.) adds that Conover has shown the relative merits of the two methods depend on the underlying distribution of the data, so neither is always better.
In practice, the safe approach is to report how many pairs had a zero difference and which setting you used. In the worked example one of ten pairs is dropped, so the effective sample is nine. If you are reporting from SPSS, R or Python, look up the documentation for the exact default of your version rather than assuming it matches another program. R's help page for wilcox.test does not describe zero handling, so do not attribute a zero rule to R without checking.
◆ Question 8 / 10 · R, SPSS, Python
How do you run it in R, SPSS and Python?
Direct answer: In R, call wilcox.test with paired = TRUE. In Python, use scipy.stats.wilcoxon. In SPSS, follow a step-by-step tutorial for your version, such as the one from Laerd Statistics (2018). All three start from two columns of paired scores and report a test statistic and a p-value.
In R, R Core Team (n.d.) states that when both x and y are given and paired is TRUE, a Wilcoxon signed rank test of the null that the distribution of x - y is symmetric about mu is performed. The call is wilcox.test(after, before, paired = TRUE). In Python, SciPy (n.d.) documents scipy.stats.wilcoxon, which tests whether the distribution of the differences x - y is symmetric about zero. The call is scipy.stats.wilcoxon(after, before), with the zero_method and correction arguments described above.
For SPSS menu paths, follow IBM's current documentation for your version, because menus change between releases. Laerd Statistics (2018) publishes a tutorial for the Wilcoxon signed-rank test in SPSS Statistics that lists the assumptions and walks through the output.
Whatever you use, read the output in three parts. First, the test statistic (T or W, depending on the program, and Z if reported). Second, the p-value, and whether it is exact or approximate. Third, the number of pairs actually used. If the program reports fewer pairs than you entered, zeros are the usual reason.
◆ Question 9 / 10 · Effect size
How do you calculate and interpret the effect size?
Direct answer: The common choice is r = z / sqrt(N), with Fiel Peres (2026) giving thresholds of 0.10 small, 0.30 medium and 0.50 large. The matched-pairs rank-biserial correlation is an alternative. Kerby (2014) shows it equals the favourable rank sum proportion minus the unfavourable one.
The conventions differ on what N is, so say which one you used. In the worked example z is about -2.19. With N as the number of pairs entered (10), r is 2.19 / sqrt(10), about 0.69. With N as the nine non-zero pairs it would be about 0.73, and with N as the number of observations (20, counting both scores of each pair) it would be about 0.49. These different values come from the same z, and the conventions differ between authors and software, so do not mix them when you compare your result with another study.
The rank-biserial correlation avoids that choice. Kerby (2014) defines it as r = (S_F / S) - (S_U / S), where S is the total rank sum, S_F the favourable rank sum and S_U the unfavourable one. Here S is 45, and the favourable rank sum is 41 if an increase counts as favourable, so r = 41/45 - 4/45 = 37/45, about 0.82. Fiel Peres (2026) lists interpretation thresholds for this coefficient of 0.11 small, 0.28 medium and 0.43 large. For r, Fiel Peres (2026) labels 0.10 or more as small, 0.30 or more as medium and 0.50 or more as large. Our guide on reporting effect size and confidence intervals explains how to place these figures in a results section.
◆ Question 10 / 10 · APA 7
How do you report the result in APA 7?
Direct answer: Report the test by name, the number of pairs used, the test statistic, the p-value, an effect size, and medians for the two conditions. The format below is this post's own suggestion based on common practice, not a quotation from the APA manual, so check your department's style guide.
A sentence for the worked example could read: A Wilcoxon signed-rank test indicated that scores were higher after the workshop than before (Mdn after = 14.5, Mdn before = 12), T = 4, z = -2.19, p = .028 (normal approximation), n = 9 non-zero pairs, r = .69 (N = 10 pairs). Because the data are made up, treat this as a template and never copy the numbers. The medians come from the made-up columns above: the after scores have a median of 14.5 and the before scores have a median of 12.
Three habits make the report easier for an examiner to trust:
- State the software and the settings that affect the result, such as the zero method and whether a continuity correction was used.
- Say which N you used for the effect size and give the effect-size label from the source you cite.
- Report the descriptive statistics that match the test, which are medians and ranges, not only means and standard deviations.
If you want help with the analysis side of a dissertation, MAAS data analysis support is advisory: a specialist can explain test choice and output with you, while you run the analysis and write the results yourself.
Frequently asked questions
What is the nonparametric alternative to the paired t-test?
The Wilcoxon signed-rank test. SciPy (n.d.) calls it a non-parametric version of the paired t-test, and Kerby (2014) says it is often described that way.
Is the Wilcoxon signed-rank test the same as the Mann-Whitney U test?
No. The U test is for two separate groups and the signed-rank test is for matched pairs, so the design decides. R Core Team (n.d.) shows both inside one function.
Does the test assume a normal distribution?
No, but it does assume the differences are distributed symmetrically around their median, according to GraphPad Software (n.d.). Laerd Statistics (2018) lists the same symmetry assumption.
Can I use it on Likert scale data?
Possibly, with care. Fiel Peres (2026) warns that for ordinal data the assumptions of rankable differences and consistent scale intervals are frequently unrealistic, so justify the choice.
What happens to pairs with no difference?
It depends on the software. SciPy (n.d.) discards zero differences by default, and offers pratt and zsplit as alternatives. Report which one you used.
What effect size should I report?
Either r = z / sqrt(N) or the matched-pairs rank-biserial correlation. Say which N you used, and cite the thresholds from Fiel Peres (2026).
References
Fiel Peres, F. (2026). Effect sizes for nonparametric tests. Biochemia Medica, 36(1). https://doi.org/10.11613/bm.2026.010101
GraphPad Software. (n.d.). Results: Wilcoxon matched pairs test. GraphPad Prism 11 Statistics Guide. https://www.graphpad.com/guides/prism/latest/statistics/how_the_wilcoxon_matched_pairs_test_works.htm
Kerby, D. S. (2014). The simple difference formula: An approach to teaching nonparametric correlation. Comprehensive Psychology, 3, Article 1. https://doi.org/10.2466/11.IT.3.1
Laerd Statistics. (2018). Wilcoxon signed-rank test using SPSS Statistics. Lund Research Ltd. https://statistics.laerd.com/spss-tutorials/wilcoxon-signed-rank-test-using-spss-statistics.php
R Core Team. (n.d.). Wilcoxon rank sum and signed rank tests [wilcox.test help page]. https://stat.ethz.ch/R-manual/R-devel/library/stats/html/wilcox.test.html
SciPy. (n.d.). scipy.stats.wilcoxon (SciPy v1.18.0 manual). https://docs.scipy.org/doc/scipy/reference/generated/scipy.stats.wilcoxon.html
Wilcoxon, F. (1945). Individual comparisons by ranking methods. Biometrics Bulletin, 1(6), 80–83. https://doi.org/10.2307/3001968
Not sure how this guide applies to your own case? Talk it through with MAAS in a free 20-minute consultation.
Book a free consultation ▸