
◆ Research Methods
What is Spearman's rank correlation and how do you interpret it?
Category: research-methods
Last updated: 2026-10-21
A student plots revision hours against exam score for eight classmates and sees the points climb, but one very high value drags the line off course. Spearman's rank correlation is the usual answer to that problem, and also the standard choice for ordinal data such as satisfaction ratings. The guide covers when to choose it, how to calculate it with tied scores, and how to report it in APA 7.
Direct answer: Spearman's rank correlation measures how consistently one variable rises or falls as another does, using ranks instead of raw values. It runs from -1 to 1, suits ordinal data, skewed data and data with outliers, and is the nonparametric counterpart of Pearson's correlation. You rank each variable, then correlate the ranks.
◆ Question 1 / 6 · Uses
What is Spearman's rank correlation used for?
Direct answer: Use it when you want to describe the strength and direction of a monotonic relationship, one where two variables move in the same direction or opposite directions without needing a straight line. It fits ordinal ratings, non-normal data and samples with outliers (Schober et al., 2018).
Schober et al. (2018), writing in Anesthesia & Analgesia for readers who are not statisticians, set out the situations in one sentence: "For nonnormally distributed continuous data, for ordinal data, or for data with relevant outliers, a Spearman rank correlation can be used as a measure of a monotonic association" (p. 1763). The coefficient goes back to Spearman (1904), published in The American Journal of Psychology more than a century ago, so it is one of the oldest tools in applied statistics. Laerd Statistics (n.d.) lists the variable types it accepts as ordinal, interval or ratio, which is the practical test: if both variables can be put in order, Spearman can be calculated.
A linear relationship adds the same number of marks for every extra hour of study. A monotonic one only needs the direction to hold: more study never predicts fewer marks, even if the gain flattens out. Schober et al. (2018) note that Spearman can analyse nonlinear relationships that are monotonic, and that it tends to be relatively robust against outliers. A relationship that rises then falls is not monotonic, and neither coefficient describes it well. Plot the data first.
◆ Question 2 / 6 · Vs Pearson
What is the difference between Spearman and Pearson correlation?
Direct answer: Pearson works on the raw values and measures the strength of a straight-line relationship, while Spearman works on the ranks and measures a monotonic one. Pearson suits roughly normal interval or ratio data. Spearman is preferred for ordinal data, heavy-tailed distributions and outliers, at a small cost in precision when the data are normal.
Pearson and Spearman side by side
Each row sets one feature of Pearson's r beside Spearman's rank correlation.
Pearson's r
Spearman's rank correlation
Works on raw values
Works on ranks of the values
Measures a linear relationship
Measures a monotonic relationship
Interval or ratio data
Ordinal, interval or ratio data
Outliers can distort the result
Tends to be relatively robust against outliers
Save this figure
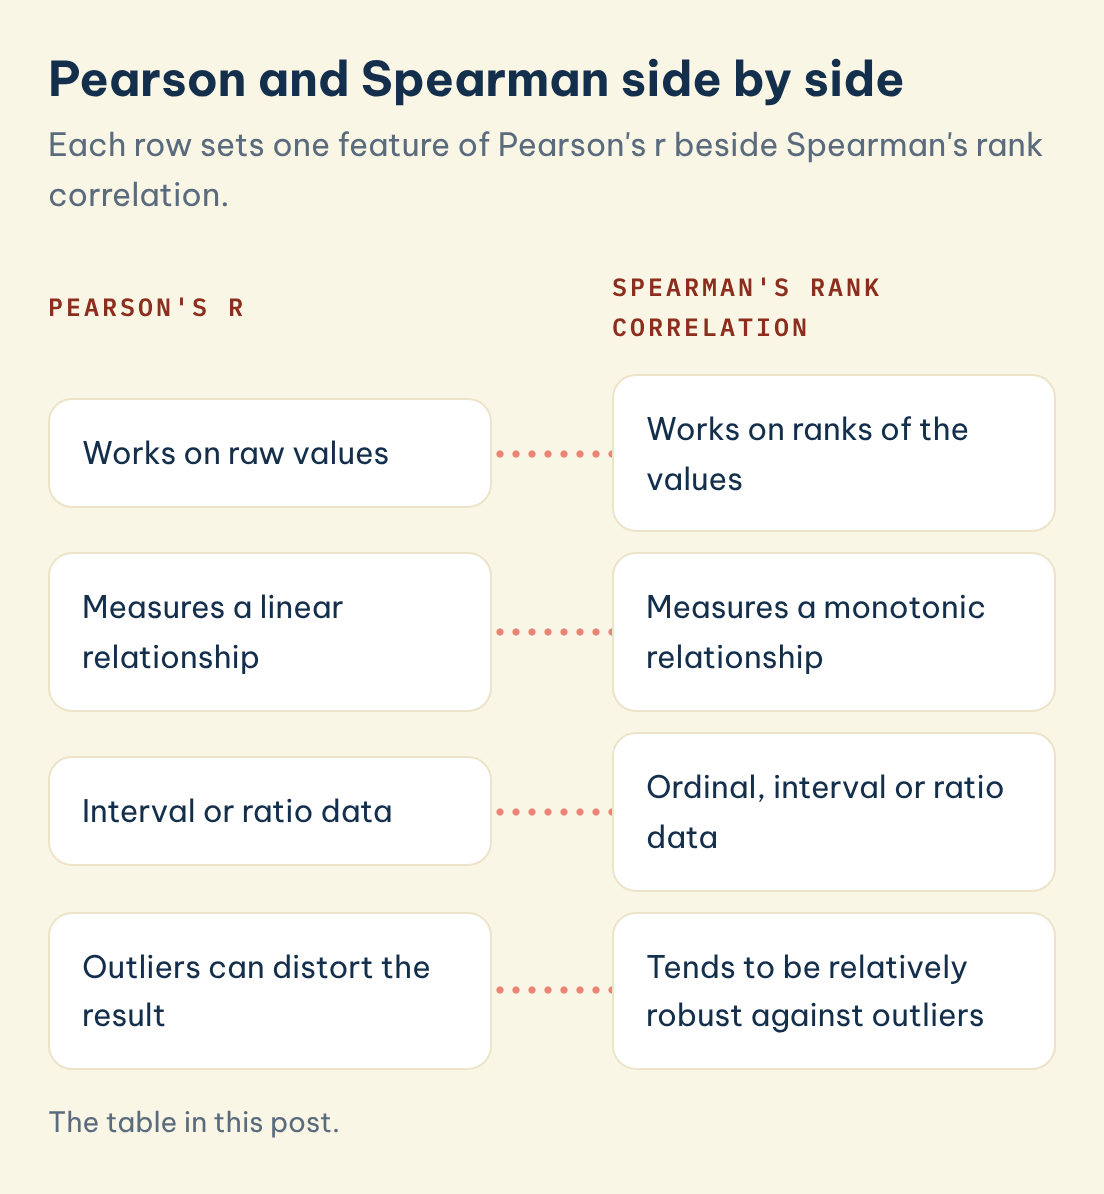
The table sets the two side by side.
| Feature | Pearson's r | Spearman's rank correlation |
|---|---|---|
| Works on | Raw values | Ranks of the values |
| Relationship measured | Linear | Monotonic |
| Data types | Interval or ratio | Ordinal, interval or ratio |
| Outliers | Can distort the result | Tends to be relatively robust |
| Normality | Assumed for the significance test | Not required |
| Range | -1 to 1 | -1 to 1 |
de Winter et al. (2016) compared the two coefficients across distributions and sample sizes in simulations and with empirical data. Their results point the same way as the table: Spearman is the better choice for heavy-tailed distributions and outliers, while Pearson is slightly better for normal data (de Winter et al., 2016).
Both assume independent pairs. Schober et al. (2018) warn that multiple observations from the same participants violate this, so a dataset with repeated measures needs a different approach. For choosing among tests more broadly, the guide to choosing the right statistical test places correlation in the wider decision.
◆ Question 3 / 6 · Method
What is Spearman's rank correlation method?
Direct answer: The method has three steps. Rank each variable separately from smallest to largest, give tied scores the average of the ranks they would occupy, then calculate the correlation between the two sets of ranks. The result is the coefficient, written rho, which keeps the -1 to 1 range.
Replacing 30 hours with "rank 8" removes how far 30 sits from the rest, so a single extreme value cannot pull the coefficient far.
Ties need one rule. Laerd Statistics (n.d.) works through English and maths marks for 10 students and shows two scores of 61 that would occupy ranks 6 and 7: both receive the average rank, (6 + 7) / 2 = 6.5, and the next score takes rank 8.
Laerd Statistics (n.d.) also gives the two calculation routes. With no tied ranks, the shortcut formula applies:
rs = 1 - 6Σd² / n(n² - 1)
where d is the difference between each pair of ranks and n is the number of pairs. With tied ranks, the shortcut is only approximate, and the safe route is to apply Pearson's formula to the ranks themselves.
◆ Question 4 / 6 · Worked example
How do you calculate Spearman's rank correlation coefficient step by step?
Direct answer: Rank both variables, subtract each pair of ranks to get d, square the differences, add them up and put the total into the formula. Where ranks are tied, give each tied score the average rank and check the result by correlating the two rank columns directly. The example below uses invented data for eight students.
The data are made up for teaching: hours of revision (x), from 2 to 30 hours, and exam score out of 100 (y), from 41 to 95 marks. One score appears twice, with students D and E both on 60 marks, so the tie rule is needed. One student revised for 30 hours, 18 hours more than the next highest (12 hours), which is the kind of outlier that troubles Pearson. On the ranks, that student is simply 8th, one place above the 7th.
| Student | Hours (x) | Score (y) | Rank x | Rank y | d | d² |
|---|---|---|---|---|---|---|
| A | 2 | 41 | 1 | 1 | 0 | 0 |
| B | 3 | 55 | 2 | 3 | -1 | 1 |
| C | 5 | 52 | 3 | 2 | 1 | 1 |
| D | 6 | 60 | 4 | 4.5 | -0.5 | 0.25 |
| E | 8 | 60 | 5 | 4.5 | 0.5 | 0.25 |
| F | 9 | 72 | 6 | 7 | -1 | 1 |
| G | 12 | 70 | 7 | 6 | 1 | 1 |
| H | 30 | 95 | 8 | 8 | 0 | 0 |
The two scores of 60 marks would occupy ranks 4 and 5, so each receives 4.5, the mean of 4 and 5. The squared differences add up to Σd² = 4.5. With n = 8, the denominator is 8 × (64 - 1) = 504, so the shortcut gives 1 - (6 × 4.5) / 504 = 1 - 0.0536 = .946. Six of the eight differences are 1 or less in size, which is why the coefficient is so close to 1.
Because a tie is present, the safer route is Pearson's formula on the ranks, and it gives rs = .946 as well (.9461 against .9464 before rounding). The two agree closely here because only one pair is tied. With many ties the rank-based route is the one to report. For comparison, Pearson's r on the raw hours and scores is .936.
◆ Question 5 / 6 · Interpretation
How do you interpret Spearman's rank correlation and test it?
Direct answer: Read the sign for direction and the size for strength, then judge strength with the convention of your own field, because labels such as weak and strong differ between disciplines. Report a confidence interval alongside the significance test, since the p value says nothing about how strong the association is.
For the example above, rs = .946 means the ranks of hours and scores agree closely: students who revised more tended to score higher. Akoglu (2018), in the Turkish Journal of Emergency Medicine, shows that interpretation labels differ across psychology, medicine and politics, so name the convention you use and cite it rather than quoting a universal scale. Squaring a coefficient gives a rough share of shared variation: .946 squared is about .90, so roughly 90% of the variation in the example ranks is shared. Schober et al. (2018) use a coefficient of 0.42 as their illustration, which gives R² of 0.18, meaning about 18% of the variation is shared. In a Spearman analysis that share refers to the ranks, not the original units.
The significance test asks whether the coefficient differs from zero. For the example, the usual t approximation, t = rs√((n - 2) / (1 - rs²)), gives t(6) = 7.16 and p < .001. That calculation is approximate for a sample this small, so report what your software returns.
Schober et al. (2018) caution that with large datasets very small coefficients can reach significance, and that the p value gives no information about strength. They recommend always reporting a confidence interval, and show a coefficient of 0.42 with a 95% CI of 0.03 to 0.70, a range too wide for a definitive conclusion. A Fisher z approximation for the example gives a 95% CI of roughly .72 to .99. With eight students the interval is wide even though the coefficient is high. The guide to reporting effect sizes and confidence intervals covers the interval side in more depth.
◆ Question 6 / 6 · APA 7
How do you report Spearman's rank correlation in APA 7?
Direct answer: Italicise the symbol, give the degrees of freedom in parentheses, drop the leading zero and report the exact p value to two or three decimals (or p < .001 when smaller), as in the example below. Add the 95% confidence interval and describe the relationship in plain words. Name your software and how you handled ties.
The American Psychological Association (n.d.) numbers and statistics guide asks writers to italicise statistical symbols, to omit the leading zero for values that cannot exceed 1, such as correlations and p values, and to report exact p values to two or three decimals. The degrees of freedom are n - 2, here 8 - 2 = 6, and you should follow the format your department or journal shows.
A sentence for the example reads: "Revision hours and exam score were strongly and positively associated, rs(6) = .95, 95% CI [.72, .99], p < .001." State the sample size, the tie handling and the software version. If the discussion chapter interprets the coefficient, the discussion section guide explains how to tie a result back to the literature without overclaiming.
To cite the method itself, Spearman (1904) is the original source. Schober et al. (2018) is often a better citation for why you chose the test.
Frequently asked questions
Is Spearman's rank correlation the same as Spearman's rho?
Yes. Rho and rs name the same coefficient, the one Spearman (1904) introduced. Use one symbol consistently and define it the first time it appears in your report.
When should I use Spearman instead of Pearson?
Choose Spearman for ordinal data, non-normal data and outliers. Choose Pearson when both variables are roughly normal interval or ratio data and the scatterplot looks like a straight line (de Winter et al., 2016). Look at the scatterplot first.
How do I handle tied ranks?
Give each tied value the average of the ranks it would have taken, as in two scores of 61 sharing rank 6.5 (Laerd Statistics, n.d.). With ties, apply Pearson's formula to the ranks rather than the shortcut formula, or let your software do it.
Do I need a table of critical values?
Software reports the p value directly. If your marker asks for a table of critical values, use the one in your course textbook.
What does a Spearman correlation of zero mean?
No monotonic association (Schober et al., 2018). The variables could still be related in a non-monotonic way, such as a curve that rises then falls, so always inspect the plot.
Can I use Spearman with repeated measures from the same people?
No. The coefficient assumes the pairs are independent, and several observations from one participant break that assumption (Schober et al., 2018). Use a method for repeated data.
Related resources
- Choosing the right statistical test: where correlation sits among the common tests
- Reporting effect sizes and confidence intervals: how to present the interval that goes with your coefficient
- Thesis statistics help: common statistics decisions in a dissertation
- SPSS, R and Python data analysis service: guidance on running and interpreting your own analysis
Ready to start? Book a free 20-minute consultation. Bring your dataset description and your unit's reporting guide, and we will match you to an expert in your discipline.
References
- Akoglu, H. (2018). User's guide to correlation coefficients. Turkish Journal of Emergency Medicine, 18(3), 91-93. https://doi.org/10.1016/j.tjem.2018.08.001
- American Psychological Association. (n.d.). Numbers and statistics guide. https://apastyle.apa.org/instructional-aids/numbers-statistics-guide.pdf
- de Winter, J. C. F., Gosling, S. D., & Potter, J. (2016). Comparing the Pearson and Spearman correlation coefficients across distributions and sample sizes: A tutorial using simulations and empirical data. Psychological Methods, 21(3), 273-290. https://doi.org/10.1037/met0000079
- Laerd Statistics. (n.d.). Spearman's rank-order correlation. https://statistics.laerd.com/statistical-guides/spearmans-rank-order-correlation-statistical-guide.php
- Schober, P., Boer, C., & Schwarte, L. A. (2018). Correlation coefficients: Appropriate use and interpretation. Anesthesia & Analgesia, 126(5), 1763-1768. https://doi.org/10.1213/ANE.0000000000002864
- Spearman, C. (1904). The proof and measurement of association between two things. The American Journal of Psychology, 15(1), 72-101. https://doi.org/10.2307/1412159
Tools & resources
- Laerd Statistics: Spearman's rank-order correlation: a worked example with tied ranks
- statstutor: Spearman's correlation: a UK university-funded handout with worked examples
This article is part of the MAAS Journal series for Vietnamese international students. With MAAS data analysis support, an expert in your discipline works through your own dataset with you so you understand each choice and can explain it to your marker. We guide students through worked examples, output and feedback, and we do not write or analyse assignments on students' behalf.
Not sure how this guide applies to your own case? Talk it through with MAAS in a free 20-minute consultation.
Book a free 20-minute consultation ▸