
◆ Research Methods
What is simple linear regression and how do you report it?
Simple linear regression is a statistical method that fits a straight line through data to show how one continuous outcome changes as one predictor changes, and it is often the first inferential test in a quantitative dissertation. The line gives you two numbers to interpret, an intercept and a slope, plus R² to say how much of the outcome the line accounts for.
Running the model in SPSS, R or Python takes minutes; marks are lost in interpretation. This guide answers common questions UK and Australian students search for about linear regression: what it is in plain terms, how the formula relates to y = mx + b, what the slope and R² mean, which assumptions you must check, when ANOVA is the better choice, and how to write the result in APA style.
◆ Question 1 / 8 · In simple terms
What is a linear regression in simple terms?
Direct answer: Linear regression describes the relationship between a dependent variable and one or more independent variables with a straight line, so you can estimate the outcome from the predictor. Simple linear regression uses exactly one predictor. Schneider et al. (2010) list 3 uses: description, estimation and prognostication.
The dependent variable, also called the outcome or response, is the thing you want to explain, such as an exam score. The independent variable, also called the predictor, is the thing you think explains it, such as weekly study hours. The dependent variable must be continuous, while the predictor can be continuous, binary or categorical (Schneider et al., 2010). That rule is why a yes or no outcome, such as pass or fail, needs logistic regression instead.
The method does not tell you that the predictor causes the outcome. A survey dissertation that finds study hours predict exam scores has found an association; whether more study causes higher scores depends on the research design, not on the regression output.
◆ Question 2 / 8 · y = mx + b
Is linear regression just y = mx + b?
Direct answer: Yes, in its simple form. Statistics texts write the line as Y = a + bX, where a is the intercept and b is the slope (Schneider et al., 2010). That is the school formula y = mx + b with different letters, except that regression estimates a and b from noisy data.
| School algebra | Regression notation | What it means in your dissertation |
|---|---|---|
| y | Y (or ŷ for the predicted value) | The outcome you measured |
| m | b (the slope, or regression coefficient) | Change in the outcome for each 1-unit increase in the predictor |
| x | X | The predictor you measured |
| b | a (the intercept, or constant) | Predicted outcome when the predictor equals 0 |
Because real data never sit exactly on a line, the model also has an error term, the gap between each observed value and the value the line predicts. Ordinary least squares (OLS), the default method in IBM SPSS Statistics, R and the Python library scikit-learn, chooses the line that makes the sum of those squared gaps as small as possible (Field, 2018). Google for Developers (n.d.) describes the same idea for machine learning, where the slope is called a weight and the intercept a bias, so the "linear regression in machine learning" results you see in search are the same model under different names.
◆ Question 3 / 8 · Slope and intercept
How do you interpret the slope and the intercept?
Direct answer: The slope is the predicted change in the outcome for each 1-unit increase in the predictor, in the units you measured. The intercept is the predicted outcome when the predictor is 0, and it is often meaningless when 0 lies outside your data. Always state the units, because the slope changes when the units change.
In a fictitious worked example of 135 adults aged 18 to 27 (Schneider et al., 2010), the fitted line for weight in kilograms against height in centimetres was Y = -133.18 + 1.16 × X. The slope of 1.16 means predicted weight rises by 1.16 kg for each extra centimetre. Measured in metres, the same slope would read 115.91, which is why units must appear in your write-up. The intercept of -133.18 would be the weight of someone 0 cm tall, a value no one in the study could have.
The same paper warns against stretching the line beyond the data: "In general, only values within the range of observations of the independent variables should be used in a linear regression model" (Schneider et al., 2010, p. 778). In a dissertation, that means you should not use a model fitted to students who study 2 to 20 hours a week to predict the score of a student who studies 40.
◆ Question 4 / 8 · Is R² of 0.6 good
Is an R² value of 0.6 good?
Direct answer: It depends on your field and your purpose. An R² of 0.6 means the model accounts for 60% of the variance in the outcome. In simple regression, R² is the square of Pearson's r (Schneider et al., 2010), so 0.6 corresponds to r of about ±0.77, a strong correlation in most social science work.
An R² of 0.6 explains 60% of the variance, leaves 40% unexplained, and means r is about ±0.77, because R² is r squared. R², the coefficient of determination, measures how well the line fits the data you collected. In the height and weight example, R² was 0.785, so 78.5% of the variance in weight was associated with height and the remaining 21.5% was left to other factors (Schneider et al., 2010). Two cautions are worth repeating in your discussion chapter. A high R² does not show that a straight line is the right shape for the data, which is why Schneider et al. (2010) put the scatter plot first, and no value of R² turns an association into a cause.
What counts as acceptable varies. Controlled laboratory measurements often produce R² close to 1, while models of human behaviour such as satisfaction or intention commonly explain far less, because many unmeasured factors affect people. Rather than calling a value "good", compare it with published studies in your area and report it next to the slope and its confidence interval, which tell the reader how large the effect is. Our guide to reporting effect size and confidence intervals covers that part of the write-up.
◆ Question 5 / 8 · Assumptions
Which assumptions must you check before you trust the model?
Direct answer: Check that the relationship is linear, that residuals are independent, that residuals have roughly constant spread (homoscedasticity), and that residuals are approximately normal. Inspect a scatter plot first, then residual plots. Schneider et al. (2010) state that the initial judgement should always rest on a scatter plot.
| Assumption | What it means | How to check it |
|---|---|---|
| Linearity | The outcome changes in a straight-line pattern with the predictor | Scatter plot of Y against X |
| Independence | Each observation is unrelated to the others | Study design; Durbin-Watson statistic for ordered data |
| Homoscedasticity | Residuals have similar spread at every level of the predictor | Plot of residuals against predicted values |
| Normality of residuals | Residuals follow roughly a normal distribution | Histogram or Q-Q plot of residuals |
These assumptions concern the residuals, not the raw variables (Field, 2018), so test the normality of the residuals rather than of each variable. Bewick et al. (2003) also start from the scatter diagram, and it is worth looking there for individual points far from the rest, because in a small sample one unusual case can shift the slope. If the scatter plot curves, a straight-line model is the wrong tool: Schneider et al. (2010) note that performing a linear regression makes sense only if the relationship is linear.
◆ Question 6 / 8 · ANOVA or regression
When should you use ANOVA instead of linear regression?
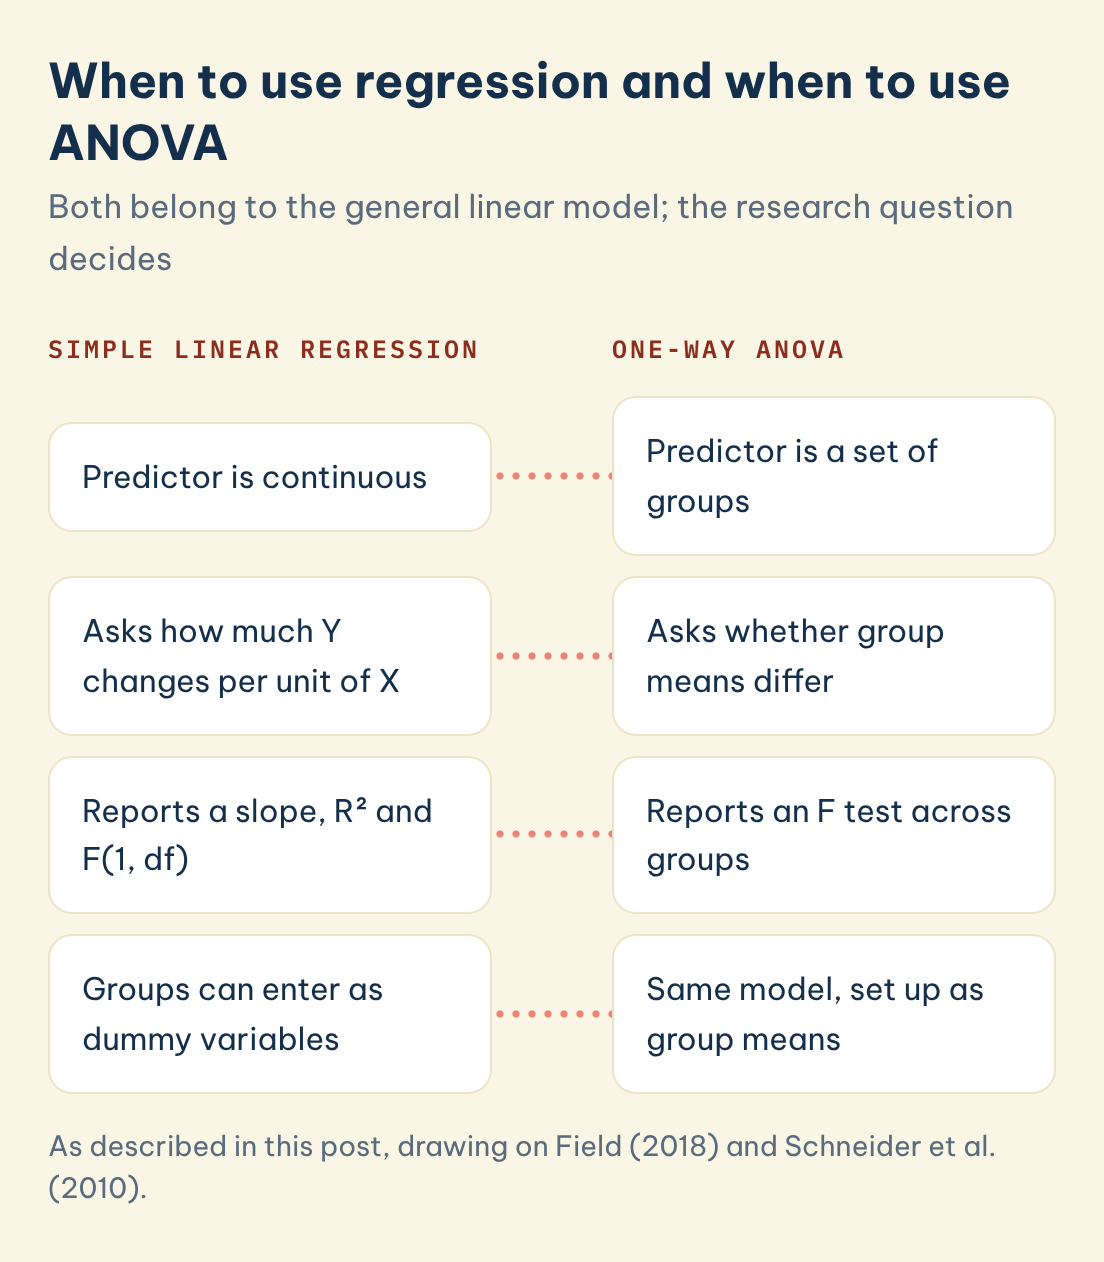
Direct answer: Use ANOVA when your predictor is a set of groups and your question is whether group means differ. Use regression when your predictor is continuous or when you want to estimate how much the outcome changes per unit. Both belong to the general linear model, so they give the same answer when set up the same way (Field, 2018).
A practical rule follows from your research question. "Do students on three teaching methods score differently?" is a comparison of group means, so one-way ANOVA reports it naturally. "How much does each extra hour of study change the score?" asks for a slope, so regression fits. Because the two methods share one underlying model, you can also enter groups into a regression as dummy variables, which is useful once you have more than one predictor (Field, 2018). Once you add more than one predictor, continue with multiple linear regression: reading coefficients, R and assumptions.
| Your question | Predictor type | Usual choice |
|---|---|---|
| Do group means differ? | Categorical (3 or more groups) | One-way ANOVA |
| How much does Y change per unit of X? | Continuous | Simple linear regression |
| Does X predict Y after controlling for Z? | Mixed | Multiple regression |
| Is the outcome yes or no? | Any | Logistic regression |
When to use regression and when to use ANOVA
Both belong to the general linear model; the research question decides
Simple linear regression
One-way ANOVA
Predictor is continuous
Predictor is a set of groups
Asks how much Y changes per unit of X
Asks whether group means differ
Reports a slope, R² and F(1, df)
Reports an F test across groups
Groups can enter as dummy variables
Same model, set up as group means
Save this figure
◆ Question 7 / 8 · APA reporting
How do you report simple linear regression in APA style?
Direct answer: Report the slope with its significance test, the variance explained and the F test for the model, with degrees of freedom and exact p values. A typical sentence reads: study hours significantly predicted exam score, b = 1.42, t(118) = 5.60, p < .001, and explained 21% of the variance, R² = .21, F(1, 118) = 31.36, p < .001.
That sentence, with b = 1.42 and 21% of variance explained, is an illustration with invented numbers, so replace every value with your own output. Schneider et al. (2010) note that the null hypothesis b = 0 is tested with a t test and that a 95% confidence interval can be computed for the coefficient, so add the interval for b in brackets if your department expects it. In simple regression the F test and the t test for the slope ask the same question, so their p values match, and t² equals F (5.60² is 31.36).
Lesson 2.8 of STAT 501 shows this with real data (Penn State Eberly College of Science, n.d.). Regressing husband's age on wife's age for 170 couples gave F(1, 168) = 1242.51, t = 35.25 for the slope and R² of 88.09%, and the t test for the slope, the ANOVA F test and the t test for Pearson's r all returned the same p value. The lesson's advice is to report the test that matches your question: the slope test when one variable is clearly the response, the correlation test when you only want an association.
Follow the APA Publication Manual (7th edition) conventions your department uses: italicise statistical symbols, give exact p values to 3 decimal places, and write p < .001 below that. Leave interpretation for the discussion chapter.
◆ Question 8 / 8 · Mentor help
Can a mentor help you interpret your regression output?
You run your own regression, because the analysis and interpretation are assessed work. A mentor checks your reasoning: whether your assumption plots support the model, whether your sentence claims a cause the design cannot support, and whether your write-up matches your department's style. Through SPSS, R and Python data analysis support at MAAS, you share your data, your output and your draft results section, and a specialist explains what each number means so you can write the interpretation yourself. Bring your brief, your SPSS or R output and your supervisor's comments to the first session. If SPSS has already produced your tables, how to interpret regression output in SPSS walks through them one at a time.
Frequently asked questions
What is the difference between correlation and simple linear regression?
Correlation measures the strength and direction of a linear relationship and treats both variables alike (Bewick et al., 2003). Regression names one variable as the outcome and estimates how much it changes per unit of the predictor (Schneider et al., 2010).
What sample size do I need for simple linear regression?
There is no single number. Run a power analysis for your expected effect size before collecting data, as explained in our guide on how to calculate sample size.
Can the predictor in linear regression be categorical?
Yes. Schneider et al. (2010) enter sex as a two-value predictor, coded 1 and 2. With any coding one unit apart, the slope equals the difference between the two group means, 14.93 kg in their example (Schneider et al., 2010).
What does a negative slope mean?
The outcome tends to fall as the predictor rises; a slope of -0.5 means a 0.5-unit drop per 1-unit increase.
Is a significant slope the same as a large effect?
No. A large sample can make a tiny slope significant, so report the slope, its confidence interval and R² rather than the p value alone.
Which software can run simple linear regression?
SPSS, R, Stata, Microsoft Excel and Python all fit the same OLS model, so the coefficients should match across them when the data are identical.
References
Bewick, V., Cheek, L., & Ball, J. (2003). Statistics review 7: Correlation and regression. Critical Care, 7(6), 451–459. https://doi.org/10.1186/cc2401
Field, A. (2018). Discovering statistics using IBM SPSS Statistics (5th ed.). SAGE.
Google for Developers. (n.d.). Linear regression. Machine Learning Crash Course. https://developers.google.com/machine-learning/crash-course/linear-regression
Penn State Eberly College of Science. (n.d.). 2.8: Equivalent linear relationship tests. STAT 501: Regression Methods. https://online.stat.psu.edu/stat501/lesson/2/2.8
Schneider, A., Hommel, G., & Blettner, M. (2010). Linear regression analysis: Part 14 of a series on evaluation of scientific publications. Deutsches Ärzteblatt International, 107(44), 776–782. https://doi.org/10.3238/arztebl.2010.0776
Tools & resources
Not sure how this guide applies to your own data? Talk it through with MAAS in a free 20-minute consultation.
Book a free consultation ▸