
◆ Research Methods
How do you interpret regression output in SPSS, line by line?
Direct answer: Read the SPSS regression output in four tables, in order. Model Summary tells you how much variance the predictors explain (R Square), the ANOVA table tests whether the model as a whole predicts the outcome, and Coefficients shows what each predictor adds while the others are held constant. Check the p-value and the confidence interval together.
◆ Question 1 / 9 · What is meant by regression
What is meant by regression analysis?
Direct answer: Regression analysis estimates how an outcome variable changes as one or more predictor variables change. The output gives you an equation, a measure of fit and a significance test for the whole model and for each predictor, which is why SPSS splits the results across several tables rather than one number.
In the worked example published by the UCLA Office of Advanced Research Computing (UCLA OARC), the outcome is a science test score for 200 high school students, and the four predictors are maths, reading and social studies scores plus a variable called female, coded 1 for female and 0 for male, as UCLA OARC (n.d.) describes. Throughout this guide we use that same example, because every value quoted below can be checked against the UCLA page. Shmueli (2010) adds a distinction worth keeping in mind before you read any table: a model built to explain why an outcome varies is not the same as a model built to predict new cases, and Shmueli (2010) warns that "conflation between explanation and prediction is common, yet the distinction must be understood for progressing scientific knowledge" (p. 289). Most dissertation regressions are explanatory, so the coefficients and their uncertainty usually matter more to your argument than how well the model would forecast unseen data.
◆ Question 2 / 9 · Which SPSS regression tables
Which SPSS regression tables should you read, and in what order?
Direct answer: SPSS produces four tables for a standard linear regression: Variables Entered/Removed, Model Summary, ANOVA and Coefficients. Read them in that order, because each answers a narrower question than the one before it, moving from what went into the model down to what each single predictor contributes.
The four SPSS regression tables, read in order
Tap a table to see the question it answers in the UCLA example.
Table 1 of 4
Variables Entered/Removed
Which predictors went into the model. Here 4 predictors, method Enter.
Table 2 of 4
Model Summary
How much variance is explained: R Square .489, Adjusted R Square .479.
Table 3 of 4
ANOVA
Whether the model as a whole predicts the outcome: F = 46.69, df 4 and 195.
Table 4 of 4
Coefficients
What each predictor adds: math B = .389, read B = .335.
Save this figure
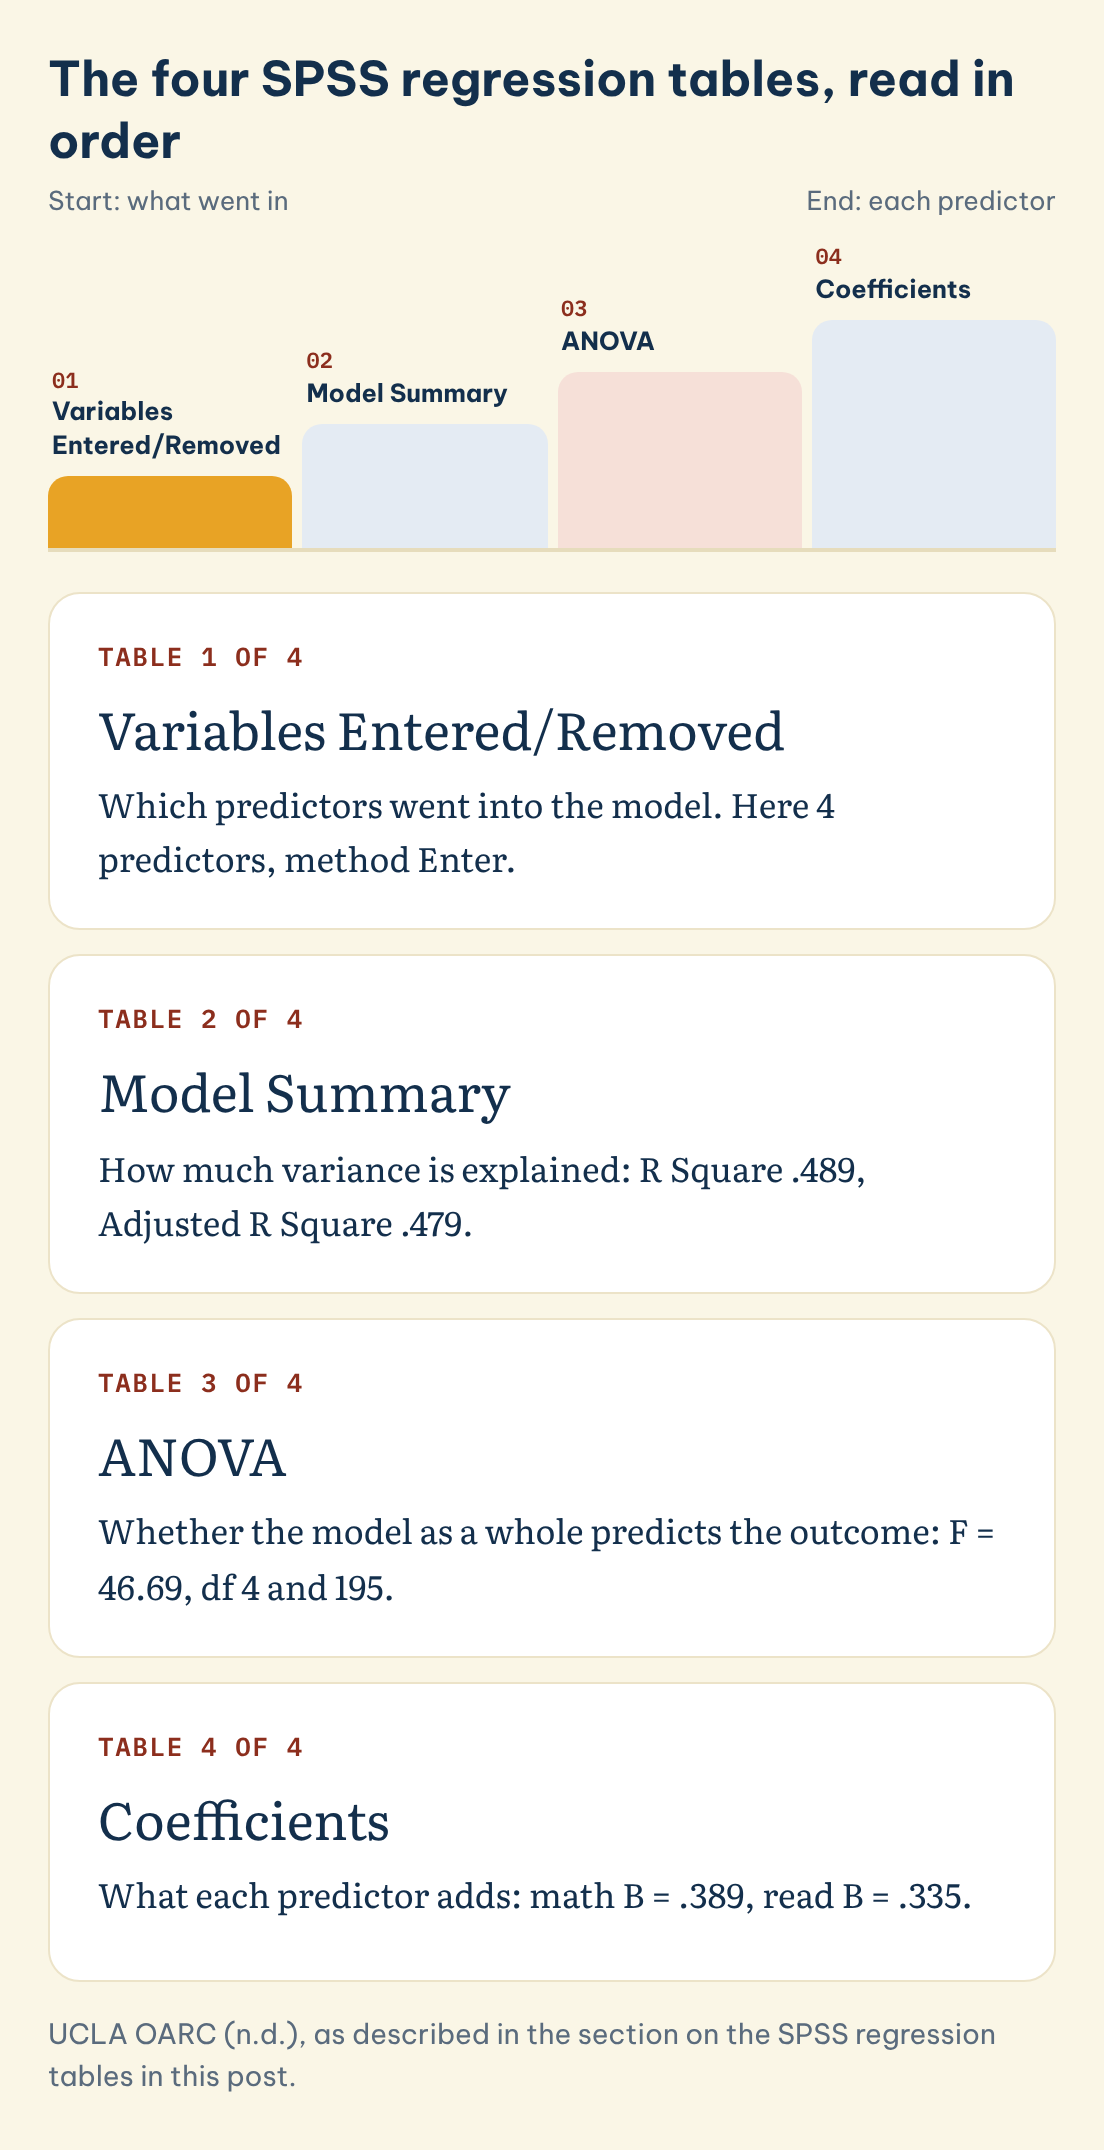
UCLA OARC (n.d.) explains that the first table simply records which predictors were entered and by which method. "Enter" means all predictors went in together, and the Variables Removed column stays empty unless you ran a stepwise regression. Confirm this table matches your plan before reading anything else, since a predictor missing here is missing from every later table. The table below summarises the example values you will meet next, as UCLA OARC (n.d.) reports them.
| SPSS table | Question it answers | Key value in the UCLA example |
|---|---|---|
| Variables Entered/Removed | What went into the model? | 4 predictors, method Enter |
| Model Summary | How much variance is explained? | R Square .489, Adjusted R Square .479 |
| ANOVA | Does the model as a whole predict the outcome? | F = 46.69, df 4 and 195, p < .001 |
| Coefficients | What does each predictor add? | math B = .389, read B = .335, female B = -2.010 (p = .051) |
◆ Question 3 / 9 · How do you read the Model
How do you read the Model Summary table?
Direct answer: R Square is the proportion of variance in the outcome that the predictors explain together. In the UCLA example, R Square is .489, so about 48.9% of the variance in science scores is predicted by the four predictors. Adjusted R Square, here .479, corrects that figure for the number of predictors.
UCLA OARC (n.d.) describes R as the correlation between the observed and the predicted values of the outcome, and R Square as an overall measure of the strength of association that does not tell you how strongly any single predictor is related to the outcome. Adjusted R Square exists because every extra predictor explains some variance by chance alone, so R Square creeps upward as you add variables even when they add nothing real. The gap between the two figures grows when the sample is small and the number of predictors is large, and it shrinks when the sample is large relative to the predictors (UCLA OARC, n.d.). With 200 students and four predictors, the example shows only a small gap of .010 between the R Square of .489, which is 48.9% of the variance, and the Adjusted R Square of .479. The last column, Std. Error of the Estimate, is the standard deviation of the residuals, which is the typical size of a prediction error expressed in the units of the outcome variable.
◆ Question 4 / 9 · Is an R² value of 0.6 good
Is an R² value of 0.6 good?
Direct answer: There is no universal cut-off for a good R². A value of 0.6 means the predictors explain about 60% of the variance in the outcome, which would be high in many social science studies and low in a tightly controlled laboratory study. Judge it against comparable published research in your field.
An R² of 0.6, or about 60% of the variance explained, can be strong or weak depending on the field. The more useful question for a dissertation is whether the model explains enough to support your argument, and how that compares with prior studies that used similar variables. Cohen (1992) proposed conventional effect sizes for multiple regression using f², which can be computed from R² as R² divided by 1 minus R². Cohen (1992) set .02 as small, .15 as medium and .35 as large, and he presented these as conventions for planning sample sizes rather than as quality grades. By that convention an R² of .489 in the UCLA example corresponds to an f² of about .96, well above the large threshold, but the label only describes size, not importance. Wasserstein and Lazar (2016) make the same point about significance, stating that "a p-value, or statistical significance, does not measure the size of an effect or the importance of a result" (p. 132). Report R² and Adjusted R² together, and interpret them in words your reader can follow.
◆ Question 5 / 9 · Is ANOVA a regression test
Is ANOVA a regression test?
Direct answer: The ANOVA table inside SPSS regression output is not a separate analysis of group means. It is the overall F test of the regression model, asking whether all the predictors together predict the outcome better than the mean alone. A significant F tells you the model as a whole works, not which predictor does.
UCLA OARC (n.d.) explains that the table splits the total variability into the part explained by the predictors (Regression) and the part left unexplained (Residual), and that the two sums of squares add up to the total. Dividing each sum of squares by its degrees of freedom gives the mean squares, and the F value is the regression mean square divided by the residual mean square. In the example that gives F = 46.69 with 4 and 195 degrees of freedom, and a p-value small enough that SPSS prints it as .000, which you should report as p < .001. UCLA OARC (n.d.) stresses that this is "an overall significance test" of the predictors used together and says nothing about any one of them. Statistically, ANOVA and linear regression belong to the same family of linear models, which is why the same table appears in both procedures, but in a regression write-up you report it as the model F test.
◆ Question 6 / 9 · How do you interpret
How do you interpret the Coefficients table?
Direct answer: Each unstandardised coefficient (B) is the predicted change in the outcome for a one-unit increase in that predictor, holding the other predictors constant. In the UCLA example, each extra point in maths predicts a .389 point rise in science. The Sig. column tests whether each B differs from zero.
UCLA OARC (n.d.) walks through every row. The maths coefficient of .389 means each extra maths point predicts a .389 point rise in science, holding the other predictors constant. The constant, 12.325, is the predicted science score when all predictors equal zero, and UCLA OARC (n.d.) notes that a significant intercept is rarely of substantive interest. Reading has B = .335 and is significant, while social studies has B = .050 and is not. The female coefficient of -2.010 means females are predicted to score about 2 points lower than males with the other scores held equal, but its p-value of .051 is above .05, so it is not significant on a two-tailed test at that level (UCLA OARC, n.d.). The Beta column gives standardised coefficients, which put all variables on the same scale so that you can compare their relative weight, something you cannot do with B values measured in different units. The t value is B divided by its standard error, and the confidence interval shows the plausible range of each coefficient: if it includes zero, the coefficient is not significant at the matching alpha level.
◆ Question 7 / 9 · What should you do
What should you do with a p-value that sits close to .05?
Direct answer: Report it exactly and interpret it cautiously. A p-value of .051 is not meaningfully different from .049, so describe the coefficient, its confidence interval and its direction rather than treating .05 as a wall. Wasserstein and Lazar (2016, p. 131) warn against decisions based only on crossing a threshold.
A p-value of .051 and one of .049 carry almost the same evidence, yet a rigid .05 rule sorts them into opposite boxes. The female coefficient in the UCLA example is a useful case, because its p-value of .051 sits just above the conventional .05 level, so a strict two-tailed reading at .05 would call it non-significant (UCLA OARC, n.d.). Wasserstein and Lazar (2016) state that "scientific conclusions and business or policy decisions should not be based only on whether a p-value passes a specific threshold" (p. 131). Greenland et al. (2016) add that a confidence interval is often more informative than a p-value because it shows the size of the effects that are compatible with the data, and they list common misreadings of both. In practice, write the exact p-value, the B, and the 95% confidence interval, then state in plain words what the estimate suggests and how uncertain it is. Our guide on how to report effect size and confidence intervals covers the reporting format in more detail.
◆ Question 8 / 9 · What's the difference
What's the difference between correlation and regression?
Direct answer: Correlation measures how strongly two variables move together, with no direction of prediction. Regression models one variable as the outcome and estimates how it changes with one or more predictors, while holding the others constant. The R in the Model Summary is itself a correlation, between observed and predicted outcome values.
That link explains why students sometimes see similar numbers in both analyses. With a single predictor, R in a regression equals the absolute size of the Pearson correlation between the two variables, but once you add more predictors the regression adds something correlation cannot give you: the unique contribution of each predictor after the others are taken into account (UCLA OARC, n.d.). In the example, the reading coefficient of .335 is the predicted change in science per reading point among students with the same maths, social studies and female values. Neither analysis proves cause and effect on its own, and Shmueli (2010) reminds researchers that explanation needs a theoretical case on top of a good statistical fit. If you are still deciding between the two analyses, the guide on choosing the right statistical test maps research questions to tests. The correlation side of this comparison is explained in what the Pearson correlation coefficient r tells you.
◆ Question 9 / 9 · How can MAAS help you read
How can MAAS help you read your own regression output?
Direct answer: MAAS works alongside you on your own SPSS output. A MAAS expert explains what each table means for your hypotheses, checks that your write-up reports the right values, and points you to the sources your department expects, while the analysis decisions and the interpretation in your chapter stay your own work.
Students often bring an output file and a draft results section to a first conversation, and the expert compares the two line by line: whether the reported R Square matches the table, whether a non-significant predictor is described as having no effect when the confidence interval says the estimate is simply uncertain, and whether the standardised and unstandardised coefficients are being used for the right purpose. The SPSS, R and Python data analysis support page explains how this works for dissertation projects, from checking assumptions to reading the output with you. Because every course has its own expectations, the expert also asks for your marking criteria and your supervisor's comments, so that the explanation fits the standard you are assessed against. The first conversation is free.
Frequently asked questions
Which value in the SPSS output tells me if my regression model is significant?
The Sig. value in the ANOVA table. UCLA OARC (n.d.) describes it as the overall test of whether the predictors together reliably predict the outcome.
Should I report R Square or Adjusted R Square?
Report both. UCLA OARC (n.d.) explains that Adjusted R Square corrects for the chance improvement that each added predictor brings, which matters most in small samples with many predictors.
What is the difference between B and Beta in the Coefficients table?
B is in the original units of each variable, so it gives the predicted change per unit. Beta is standardised, so UCLA OARC (n.d.) notes it lets you compare the relative weight of predictors measured on different scales.
Why does SPSS show Sig. = .000?
SPSS rounds to three decimals, so the p-value is below .0005. Report it as p < .001 rather than p = .000.
Does a non-significant coefficient mean the predictor has no effect?
No. Wasserstein and Lazar (2016) and Greenland et al. (2016) both warn against reading non-significance as proof of no effect. Look at the confidence interval to see which effect sizes remain plausible.
How large should my sample be for multiple regression?
It depends on the effect size you expect and the number of predictors. Cohen (1992) gives sample size tables for multiple regression at small, medium and large effects, and your supervisor may expect a power analysis.
References
Cohen, J. (1992). A power primer. Psychological Bulletin, 112(1), 155-159. https://doi.org/10.1037/0033-2909.112.1.155
Greenland, S., Senn, S. J., Rothman, K. J., Carlin, J. B., Poole, C., Goodman, S. N., & Altman, D. G. (2016). Statistical tests, P values, confidence intervals, and power: A guide to misinterpretations. European Journal of Epidemiology, 31(4), 337-350. https://doi.org/10.1007/s10654-016-0149-3
Shmueli, G. (2010). To explain or to predict? Statistical Science, 25(3), 289-310. https://doi.org/10.1214/10-STS330
UCLA Office of Advanced Research Computing. (n.d.). Regression analysis: SPSS annotated output. UCLA OARC Statistical Methods and Data Analytics. https://stats.oarc.ucla.edu/spss/output/regression-analysis/
Wasserstein, R. L., & Lazar, N. A. (2016). The ASA statement on p-values: Context, process, and purpose. The American Statistician, 70(2), 129-133. https://doi.org/10.1080/00031305.2016.1154108
Not sure how this guide applies to your own case? Talk it through with MAAS in a free 20-minute consultation.
Book a free consultation ▸