
◆ Research Methods
Parametric vs non-parametric tests: how do you choose?
Parametric tests such as the t-test and ANOVA assume your data follow a known distribution, usually the normal one, while non-parametric tests such as Mann-Whitney U and Kruskal-Wallis work on ranks and make few assumptions about the shape of the population. The choice changes which numbers you report and how a marker reads your results chapter.
This guide explains both families in plain terms, pairs each common parametric test with its non-parametric partner, and gives a short decision route you can apply to a dissertation dataset. Our earlier guide on choosing the right statistical test covers the wider choice of method by research question.
◆ Question 1 / 7 · The difference
What is the difference between parametric and nonparametric tests?
Direct answer: Parametric tests rely on assumptions about the shape of the population distribution, typically normality, and about its parameters such as the mean and standard deviation. Non-parametric tests rely on no or few assumptions about that shape and usually analyse the ranks of the data rather than the raw values (Hoskin, n.d.; Nahm, 2016).
Hoskin (n.d.), a statistician at Mayo Clinic, frames the distinction around the word parameter. Means, standard deviations and proportions are parameters when they describe a whole population, and statistics when you calculate them from a sample, so a parametric procedure is one that estimates those population values under an assumed distribution. Nahm (2016) adds the practical side of the definition: non-parametric methods replace each value with its position in the ordered data. As an illustration, a score of 99 and a score of 990 can both simply be the largest observation.
That ranking step explains both the strength and the cost of the non-parametric family. Ranks are not pulled around by one extreme case, which makes them useful for skewed or ordinal data. They also discard information about the distance between values, which is why a parametric test, when its assumptions hold, usually detects a real effect more easily.
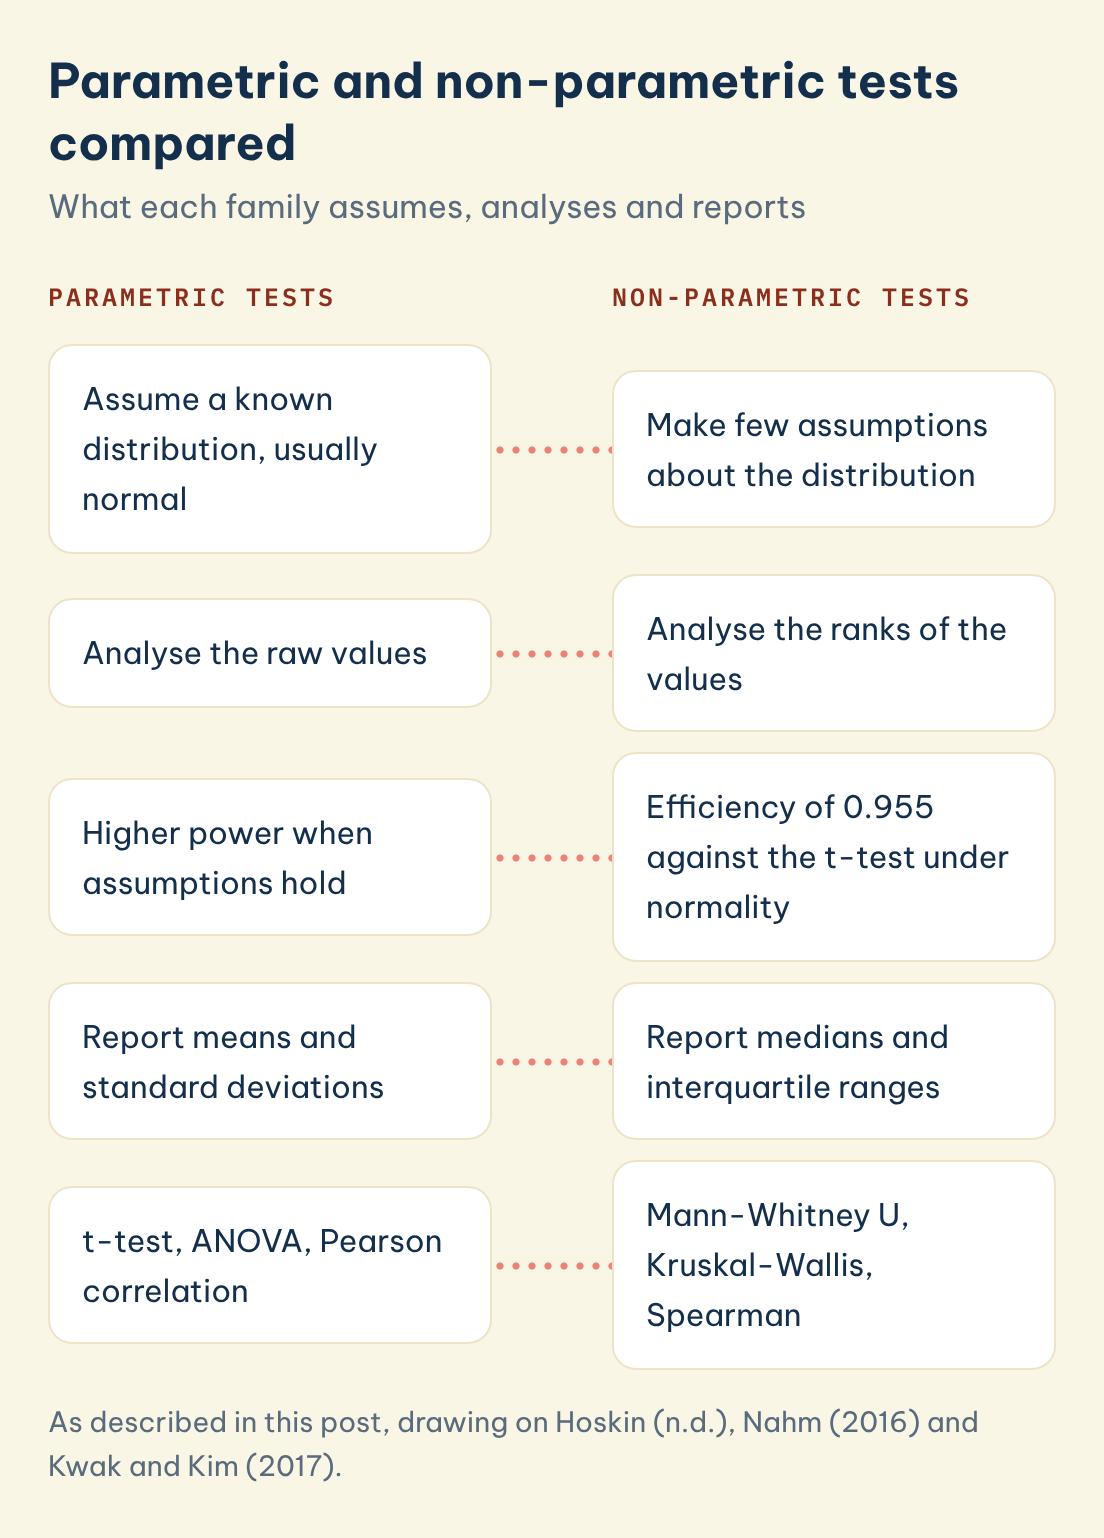
Parametric and non-parametric tests compared
What each family assumes, analyses and reports
Parametric tests
Non-parametric tests
Assume a known distribution, usually normal
Make few assumptions about the distribution
Analyse the raw values
Analyse the ranks of the values
Higher power when assumptions hold
Efficiency of 0.955 against the t-test under normality
Report means and standard deviations
Report medians and interquartile ranges
t-test, ANOVA, Pearson correlation
Mann-Whitney U, Kruskal-Wallis, Spearman
Save this figure
◆ Question 2 / 7 · Parametric tests
What is meant by a parametric test?
Direct answer: A parametric test is a procedure built on an assumed population distribution with fixed parameters, most often the normal distribution. The two-sample t-test, the paired t-test, one-way ANOVA and Pearson's correlation are the standard examples, and all of them rely on approximate normality (Hoskin, n.d.).
Kwak and Kim (2017) trace the whole family back to the central limit theorem, which says that the means of repeated random samples approximately follow a normal distribution when samples are large enough, even when the population itself does not. That result is the reason parametric tests can work on real data that only look roughly normal. Their review also states the main benefit directly: "Compared to non-parametric tests, which do not require any assumptions about the population probability distribution, parametric tests produce more accurate and precise estimates with higher statistical powers" (Kwak & Kim, 2017, p. 144).
Most parametric tests carry two further conditions that students often forget. Nahm (2016) lists equal variance between groups alongside normality as one of the two most basic prerequisites, and independent observations are assumed unless the design is paired. A test whose conditions are clearly broken can still produce a p-value, but that number no longer means what the textbook says it means.
◆ Question 3 / 7 · ANOVA
Is ANOVA parametric or non-parametric?
Direct answer: One-way ANOVA is a parametric test. It compares means across three or more independent groups and assumes approximate normality within each group and similar variances. Its non-parametric counterpart is the Kruskal-Wallis test, which compares the groups using ranks instead of means (Hoskin, n.d.).
The same pairing logic runs through the tests you are most likely to need in a dissertation. The table matches each parametric test with the non-parametric procedure that answers the same kind of question, following the list in Hoskin (n.d.) and the rank-based methods described by Nahm (2016).
| Research question | Parametric test | Non-parametric alternative |
|---|---|---|
| Compare two independent groups | Independent-samples t-test | Mann-Whitney U (Wilcoxon rank-sum) test |
| Compare two measurements from the same people | Paired t-test | Wilcoxon signed-rank test |
| Compare three or more independent groups | One-way ANOVA | Kruskal-Wallis test |
| Measure association between two variables | Pearson correlation | Spearman rank correlation |
Nahm (2016) also records the history behind these names. Frank Wilcoxon introduced a rank-based method in 1945, Mann and Whitney extended it to groups of unequal size in 1947, and Kruskal and Wallis later introduced a rank-based comparison of three or more groups. Knowing that each non-parametric test answers a specific question stops you from treating them as one generic fallback.
◆ Question 4 / 7 · Checking your data
How do I know if my data is parametric or non-parametric?
Direct answer: Data are not parametric or non-parametric in themselves; tests are. Check your variable type, then look at the distribution with a histogram and a Q-Q plot, read the skewness, and run a normality test (Mishra et al., 2019). If the data are roughly normal, a parametric test is usually appropriate.
Mishra et al. (2019) describe normality testing as an important step for continuous data, because it guides both the summary measures and the statistical method, and they note that numerical and visual methods each have advantages and disadvantages. In practice this means you should not let a single p-value from a normality test decide everything. A histogram that looks close to a bell shape, a Q-Q plot whose points follow the line, and a skewness value near zero together tell you more than one test result. The two most common normality checks are compared in Kolmogorov-Smirnov versus Shapiro-Wilk.
Variable type comes first. Ordinal data, such as pain rated as none, mild, moderate or severe, suit non-parametric methods from the start (Fagerland, 2012), and many Likert-type single items fall into the same category. Interval and ratio data, such as test scores or reaction times, can go either way depending on their shape and your sample size. The Mayo Clinic example shows why shape matters: female length of stay had a mean of 60 days but a median of 31.5 days, a strong right skew, and the t-test gave p = 0.04 while the Wilcoxon rank-sum test gave p = 0.63 (Hoskin, n.d.). When you compare groups, also check the equal spread assumption with Levene's test for equality of variances.
◆ Question 5 / 7 · When to use each
When should you use a parametric or a non-parametric test?
Direct answer: Use a parametric test when the outcome is continuous, the data are roughly normal or the sample is large, and the groups have similar spread. Use a non-parametric test for ordinal data, for small samples with clear skew or outliers, or when you care about medians and ranks rather than means (Fagerland, 2012; Nahm, 2016).
Sample size changes the answer more than many methods chapters admit. Fagerland (2012) shows that the t-test is fairly robust to deviations from normality, increasingly so as samples grow, and notes that at a sample size of 200 it is robust even to heavily skewed distributions. His simulation found that with very large, heavily skewed samples the Wilcoxon-Mann-Whitney test can reject the null in more than 90% of runs when only the spread differs, so it ends up answering a different question from the one about means. His conclusion is that non-parametric tests are most useful for small studies. He sets this against a trend in medical journals, where the median sample size in the Lancet and the BMJ rose from 33 and 37 in 1972 to 3116 and 3104 in 2007 while rank tests grew more popular (Fagerland, 2012).
The opposite risk sits at the small end. With a handful of cases per group you cannot check normality convincingly, and Nahm (2016) treats an unknown distribution caused by a small sample as a case where non-parametric techniques are excellent alternatives. A short decision route therefore looks like this: identify the variable type, check the shape and the group sizes, decide which assumption is the weak one, and then justify the test you chose in one or two sentences of your methods section.
◆ Question 6 / 7 · What you lose
What do you lose when you choose a non-parametric test?
Direct answer: You usually lose some statistical power, and you change what the result describes. When normality holds, the Wilcoxon signed-rank and Mann-Whitney tests have an asymptotic relative efficiency of 0.955 against the t-test (Nahm, 2016), so the loss is small, but the result speaks about ranks rather than mean differences.
The efficiency figure is reassuring: in large samples from normal data, a rank test needs only slightly more cases to match the t-test. The interpretation cost matters more for a dissertation. A significant Mann-Whitney result says that values in one group tend to be higher than values in the other, not that the means differ by a stated amount, so you should report medians and interquartile ranges with it rather than means and standard deviations (Mishra et al., 2019).
You also give up some of the richer models built on the parametric family, such as factorial ANOVA and regression with several predictors. If your design depends on those, consider whether a transformation, a larger sample, or a robust method would serve you better than switching to a rank test. Our guide on the differences between qualitative, quantitative and mixed methods places these choices in the wider design of a study.
◆ Question 7 / 7 · Mentor help
Can a statistics mentor help you choose and justify the test?
Direct answer: Yes. A MAAS statistics mentor can review your variables, your normality checks and your design with you, explain which test fits and why, and show you how to write the justification in your methods chapter. You run and report the analysis yourself, with the mentor checking your reasoning.
Many students lose marks not because they picked an impossible test, but because the methods section never explains the choice. A mentor session focuses on that reasoning: what your histogram shows, whether your groups are large enough for the t-test to be robust, and how to word the assumption checks so a marker can follow them. Our SPSS, R and Python help covers this kind of support for dissertation datasets, with the expert working alongside you on SPSS, R or Python output.
Frequently asked questions
Is the chi-square test parametric or non-parametric?
The chi-square test of independence is usually grouped with non-parametric methods because it works on counts in categories and makes no assumption about a normal distribution. It does have its own conditions, such as adequate expected counts in each cell.
Is Mann-Whitney U the same as the Wilcoxon rank-sum test?
They are equivalent tests for comparing two independent groups. Hoskin (n.d.) lists the Wilcoxon rank-sum test as the counterpart of the two-sample t-test, and SPSS reports it as the Mann-Whitney U test, alongside the Wilcoxon W statistic.
Can I use a t-test if my data are not normal?
Often yes, when your sample is reasonably large. Fagerland (2012) shows the t-test becomes increasingly robust to non-normality as sample size grows, and robust even to heavy skew at around 200 observations.
Is a Likert scale parametric or non-parametric?
A single Likert item is ordinal, so non-parametric tests are the safer default. Scale scores built by summing several items are often treated as continuous, but say which approach you took and why in your methods chapter.
Which is more powerful, a parametric or a non-parametric test?
A parametric test is more powerful when its assumptions hold (Kwak & Kim, 2017). The gap is small for the common rank tests, which reach an asymptotic relative efficiency of 0.955 against the t-test under normality (Nahm, 2016).
Should I report means or medians with a non-parametric test?
Report medians and interquartile ranges, because the test compares ranks rather than means. Mishra et al. (2019) link the choice of summary measure to the shape of the data in the same way.
References
Fagerland, M. W. (2012). t-tests, non-parametric tests, and large studies: A paradox of statistical practice? BMC Medical Research Methodology, 12, Article 78. https://doi.org/10.1186/1471-2288-12-78
Hoskin, T. (n.d.). Parametric and nonparametric: Demystifying the terms. Mayo Clinic CTSA BERD Resource. https://www.mayo.edu/research/documents/parametric-and-nonparametric-demystifying-the-terms/doc-20408960
Kwak, S. G., & Kim, J. H. (2017). Central limit theorem: The cornerstone of modern statistics. Korean Journal of Anesthesiology, 70(2), 144–156. https://doi.org/10.4097/kjae.2017.70.2.144
Mishra, P., Pandey, C. M., Singh, U., Gupta, A., Sahu, C., & Keshri, A. (2019). Descriptive statistics and normality tests for statistical data. Annals of Cardiac Anaesthesia, 22(1), 67–72. https://doi.org/10.4103/aca.ACA_157_18
Nahm, F. S. (2016). Nonparametric statistical tests for the continuous data: The basic concept and the practical use. Korean Journal of Anesthesiology, 69(1), 8–14. https://doi.org/10.4097/kjae.2016.69.1.8
Tools & resources
Not sure how this guide applies to your own case? Talk it through with MAAS in a free 20-minute consultation.
Book a free consultation ▸