
◆ Research Methods
Kolmogorov-Smirnov or Shapiro-Wilk: which normality test to use?
Category: research-methods
Last updated: 2026-10-21

Most SPSS output for a dissertation includes a Tests of Normality table with two rows, Kolmogorov-Smirnov and Shapiro-Wilk, and students are often unsure which one to trust when the two disagree. This guide explains what each test asks, why the sources we checked lean towards Shapiro-Wilk for most thesis datasets, how to read the table, and how to report the result without overclaiming. If you are still deciding which test your design needs in the first place, start with our guide to choosing the right statistical test.
◆ Question 1 / 6 · KS test use
What is the Kolmogorov-Smirnov test used for?
Direct answer: The Kolmogorov-Smirnov test checks whether a sample follows a stated distribution. In a dissertation it is most often used to ask whether your data are normal. It compares the sample against the reference distribution and flags a gap that is too large to put down to chance.
NIST/SEMATECH (n.d.) states the hypotheses plainly: the null hypothesis is that the data follow a specified distribution, and the alternative is that they do not. The reference distribution must be continuous. The same page lists what it regards as the most serious limitation, that the distribution has to be fully specified. If you estimate the mean and standard deviation from your own sample, as every thesis student does when testing for normality, the standard critical values are no longer valid and would have to be found by simulation.
The estimated-parameter problem is the reason a corrected version exists. Lilliefors (1967) published the adjustment for the case where the mean and variance are unknown, and SPSS applies it in its normality output. IBM (n.d.-a) documents that Explore reports the Kolmogorov-Smirnov statistic with a Lilliefors significance level alongside the Shapiro-Wilk statistic. So when you quote "the K-S test" from SPSS Explore, you are quoting the Lilliefors-corrected version, which matters when a supervisor asks how you ran it.
◆ Question 2 / 6 · Which test
Should I use Shapiro Wilk or Kolmogorov-Smirnov?
Direct answer: For most thesis datasets, the sources we checked favour Shapiro-Wilk. Razali and Wah (2011) found it the most powerful of the four tests they compared and Kolmogorov-Smirnov the least. Mishra et al. (2019) pair Shapiro-Wilk with samples under 50 and Kolmogorov-Smirnov with 50 or more.
Razali and Wah (2011) compared Shapiro-Wilk, Kolmogorov-Smirnov, Lilliefors and Anderson-Darling by simulation. Their conclusion reads: "Shapiro-Wilk test is the most powerful test for all types of distribution and sample sizes whereas Kolmogorov-Smirnov test is the least powerful test" (Razali & Wah, 2011, p. 32). Power here means the chance of catching a real departure from normality. They also found that the Lilliefors version always outperformed plain Kolmogorov-Smirnov, which supports using SPSS's corrected output and not a hand-built comparison.
Ghasemi and Zahediasl (2012) go further. Their guide for non-statisticians describes Shapiro-Wilk as better powered than Kolmogorov-Smirnov even after the Lilliefors correction, and they argue against Kolmogorov-Smirnov when parameters are estimated from the data. Their stance is stronger than many statisticians would take, so cite it as the authors' recommendation and not as a rule every field accepts. Ghasemi and Zahediasl (2012) recommend Shapiro-Wilk as the test to use.
Neither test rescues a tiny sample. Razali and Wah (2011) warn that all four tests perform poorly at sample sizes of 30 and below, so with such a small n, read a normality plot as well and report your reasoning.
◆ Question 3 / 6 · Compared
How do the two tests compare side by side?
Direct answer: Shapiro-Wilk is the usual first choice for small and medium samples, while Kolmogorov-Smirnov is printed beside it in the same SPSS table. Both tests are sensitive to sample size, and both should be read together with a Q-Q plot or histogram.
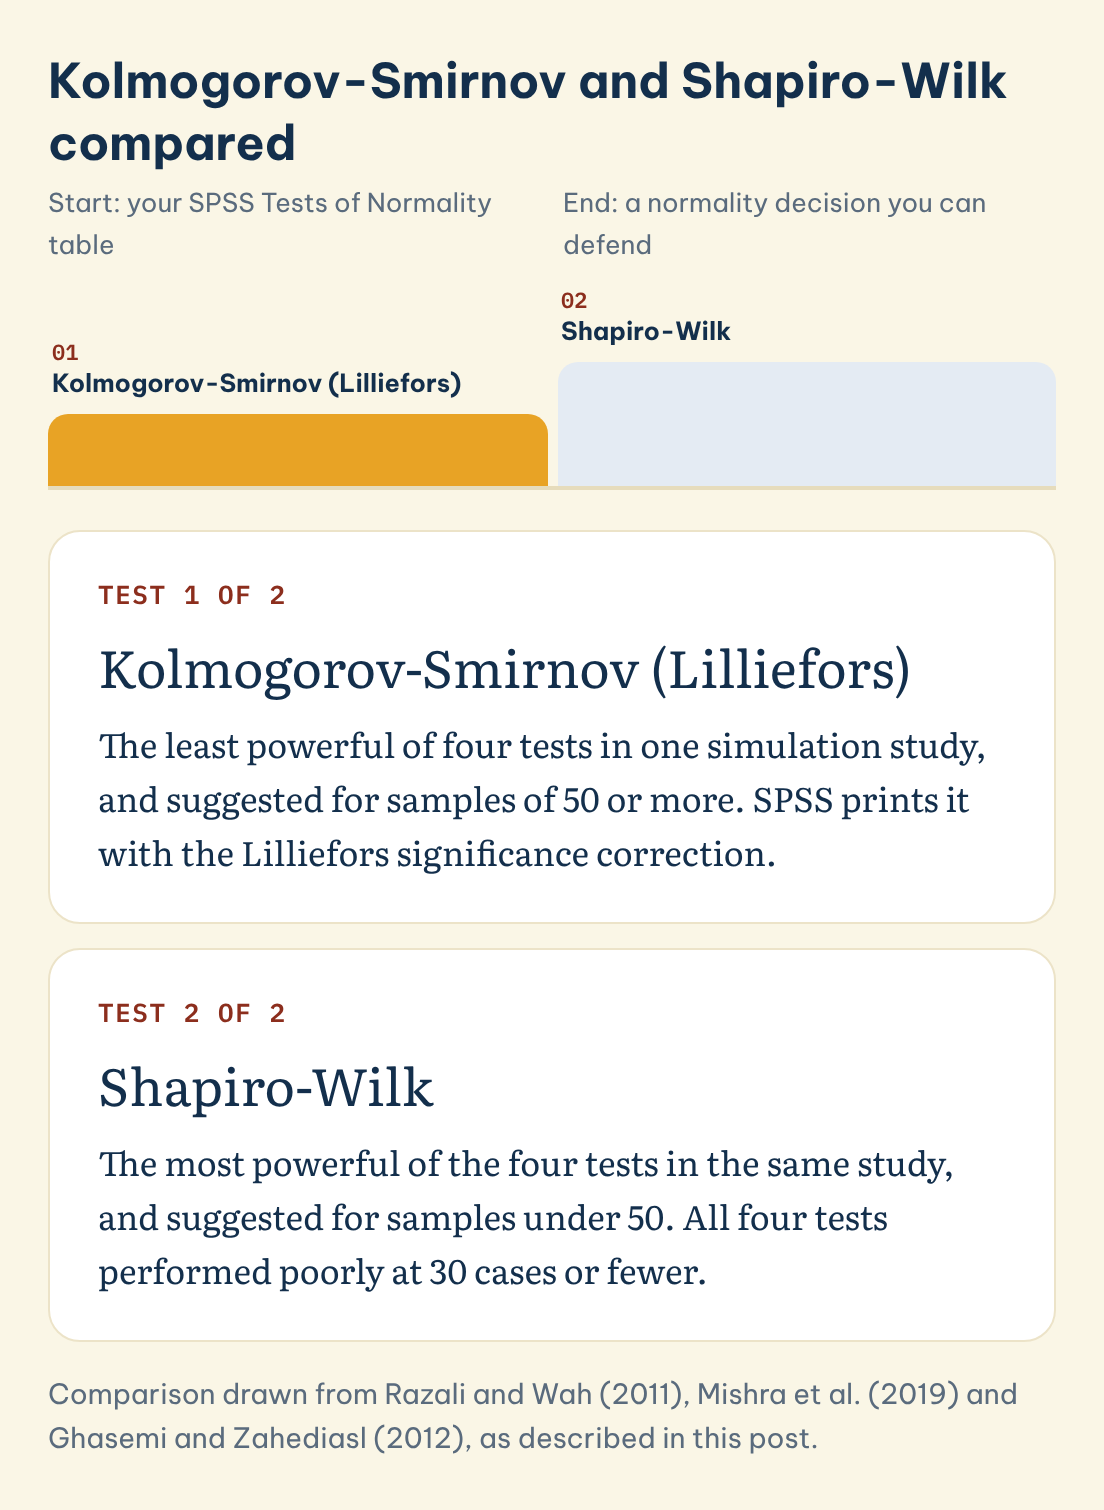
Kolmogorov-Smirnov and Shapiro-Wilk compared
Tap a test to see how the sources describe it.
Test 1 of 2
Kolmogorov-Smirnov (Lilliefors)
The least powerful of four tests in one simulation study, and suggested for samples of 50 or more. SPSS prints it with the Lilliefors significance correction.
Test 2 of 2
Shapiro-Wilk
The most powerful of the four tests in the same study, and suggested for samples under 50. All four tests performed poorly at 30 cases or fewer.
Save this figure
| Point | Kolmogorov-Smirnov (Lilliefors) | Shapiro-Wilk |
|---|---|---|
| Power in simulation | Least powerful of four tests (Razali & Wah, 2011) | Most powerful of four tests (Razali & Wah, 2011) |
| Suggested sample size | 50 or more (Mishra et al., 2019) | Under 50, though usable on larger samples (Mishra et al., 2019) |
| Estimated mean and variance | Needs the Lilliefors correction (Lilliefors, 1967) | Built for testing normality |
| Small samples (30 and below) | Weak (Razali & Wah, 2011) | Weak (Razali & Wah, 2011) |
| Large samples | Flags small, harmless gaps (Ghasemi & Zahediasl, 2012) | Very sensitive to trivial departures (Kent State University Libraries, 2026) |
| In SPSS Explore | Printed with Lilliefors significance (IBM, n.d.-a) | Printed alongside (IBM, n.d.-a) |
The two rows on sample size and sensitivity are where students most often misread the table. Small samples most often pass because the test lacks the power to object (Ghasemi & Zahediasl, 2012), and a very large sample can fail because the test objects to differences no one would see on a chart. Ghasemi and Zahediasl (2012) make the second point: with a large sample, even a small deviation from normality can give a significant result that need not matter for parametric tests. That is why Kent State University Libraries (2026) tells readers not to rely on the test alone and to look at graphs too.
◆ Question 4 / 6 · In SPSS
How do you run the Kolmogorov-Smirnov test in SPSS?
Direct answer: Open Analyze, then Descriptive Statistics, then Explore, move your variable into the Dependent List, and tick Normality plots with tests under Plots. SPSS prints a Tests of Normality table with both Kolmogorov-Smirnov and Shapiro-Wilk, plus Q-Q plots you can check by eye.
Both Ghasemi and Zahediasl (2012) and Mishra et al. (2019) describe this path. Ghasemi and Zahediasl add that the Kolmogorov-Smirnov row in this table carries the Lilliefors significance correction. Kent State University Libraries (2026) show the same table with the columns Statistic, df and Sig., and a footnote naming the Lilliefors correction.
One trap is worth knowing about. IBM's support notes say the older One-Sample Kolmogorov-Smirnov option under Nonparametric Tests did not apply the Lilliefors correction before version 21.0.0.1, so the p-values from the two menus can differ for the same data (IBM, n.d.-b). If your university guide or a classmate used the legacy menu, the numbers in your table may not match theirs even though the data are identical. State in your methods chapter which menu you used, and keep the syntax or output file so the result can be reproduced.
If your data are grouped, move the grouping variable into the Factor List so SPSS tests each group separately. Normality is usually judged within groups, not across the whole column.
◆ Question 5 / 6 · Reading it
How do you read a Kolmogorov-Smirnov test, and what is a good value?
Direct answer: There is no good or bad statistic value on its own. You read the Sig. column. A p-value above your alpha, usually .05, means you do not reject normality; a p-value at or below it is evidence that the data depart from normality. Always add a plot before you decide.
NIST/SEMATECH (n.d.) describes the Kolmogorov-Smirnov statistic as a measure of the largest gap between the sample's cumulative distribution and the reference distribution. A smaller gap means a closer fit, but the number only has meaning next to its df and p-value, so quote all three.
Kent State University Libraries (2026) give the wording for a p-value above alpha: you do not reject the null hypothesis, and there is not enough evidence to conclude that the data are non-normal. Mishra et al. (2019) say the null hypothesis is "accepted" when P is above .05, but strictly the test cannot prove normality, so write "did not reject" or "found no evidence against normality". Kent State University Libraries (2026) also note that the two tests can disagree, and their worked SPSS table shows it. For Height, Kolmogorov-Smirnov gives .045 (df 408, Sig. .049) while Shapiro-Wilk gives .993 (df 408, Sig. .070), so one test rejects normality at .05 and the other does not. For Weight, both reject: Kolmogorov-Smirnov .084 and Shapiro-Wilk .944, both with df 376 and Sig. .000. With 376 cases that is the large-sample situation where a plot decides whether the departure matters.
For reporting, MAAS suggests an APA-style line such as, using the Kent State Weight example above, "A Shapiro-Wilk test indicated a departure from normality, W(376) = .944, p < .001". This format is our suggestion for APA-style reporting, and none of the sources above prescribes it, so check your department's guide.
◆ Question 6 / 6 · If not normal
What should you do when the test says the data are not normal?
Direct answer: Do not abandon your planned analysis automatically. Check the plot, check the group sizes, then decide between a parametric test you can defend, a transformation, or a non-parametric alternative. Say in your methods chapter which route you took and why it fits.
Ghasemi and Zahediasl (2012) note that a significant result from a large sample need not stop you using a parametric test, so a Q-Q plot, skewness and kurtosis, and the size of your groups all belong in the decision. Razali and Wah (2011) recommend combining graphs with a formal test and with skewness and kurtosis. For a deeper treatment of which test follows a failed assumption, see our guide to help with thesis statistics, which separates advice you may ask for from analysis that must stay yours.
Frequently asked questions
What is the Kolmogorov-Smirnov test used for?
It tests whether a sample follows a stated continuous distribution, most often the normal distribution in thesis work (NIST/SEMATECH, n.d.). In SPSS Explore it is reported with the Lilliefors correction (IBM, n.d.-a).
Should I use Shapiro-Wilk or Kolmogorov-Smirnov?
For most thesis samples, choose Shapiro-Wilk. Razali and Wah (2011) found it the most powerful and Kolmogorov-Smirnov the least, and Mishra et al. (2019) suggest it for samples under 50. Report whichever you use and look at a plot as well.
What is a good KS test value?
No statistic value is good or bad alone. Read the Sig. column against your alpha of .05, and report the statistic, df and p-value together.
Why do my two normality tests disagree?
They have different power, and SPSS applies a correction to one. Kent State University Libraries (2026) note that one test may signal non-normality while the other does not. Use a Q-Q plot to break the tie and describe your reasoning.
Does a p-value above .05 prove my data are normal?
No. It means there is not enough evidence to conclude the data are non-normal (Kent State University Libraries, 2026). With 30 or fewer cases, Razali and Wah (2011) warn that these tests perform poorly.
Why does SPSS give a different K-S p-value from my classmate?
They may have used the older One-Sample K-S menu, which did not apply the Lilliefors correction before version 21.0.0.1 (IBM, n.d.-b). Name the menu you used and keep your output.
Need help with the statistics chapter of your thesis?
If you can run the test but are unsure how to defend your choice in the methods chapter, an hour with someone who knows SPSS can clear it up. MAAS offers data analysis support for SPSS, R and Python, where a mentor from the right discipline explains each step, shows you how to read the output and works with you on the write-up. You remain the author of the thesis, and nothing is submitted on your behalf. A free 20-minute consultation with MAAS, a Ho Chi Minh City company, is a low-pressure way to check whether this fits, and you can book one here.
Related guides
- How to choose the right statistical test: picking the test before you check its assumptions
- Thesis statistics help: what a student may legitimately ask a helper to do
- Data analysis support for SPSS, R and Python: one-to-one guidance on your analysis
References
- IBM. (n.d.-a). Explore. IBM SPSS Statistics 32.0.0 documentation. https://www.ibm.com/docs/en/spss-statistics/32.0.0?topic=features-explore
- Ghasemi, A., & Zahediasl, S. (2012). Normality tests for statistical analysis: A guide for non-statisticians. International Journal of Endocrinology and Metabolism, 10(2), 486-489. https://doi.org/10.5812/ijem.3505
- IBM. (n.d.-b). K-S test of normality in NPAR TESTS and NPTESTS does not use Lilliefors correction prior to SPSS Statistics 21.0.0.1. IBM Support. https://www.ibm.com/support/pages/k-s-test-normality-npar-tests-and-nptests-does-not-use-lilliefors-correction-prior-spss-statistics-21001
- Kent State University Libraries. (2026). Descriptive stats for one numeric variable (Explore). SPSS Tutorials. https://libguides.library.kent.edu/SPSS/Explore
- Lilliefors, H. W. (1967). On the Kolmogorov-Smirnov test for normality with mean and variance unknown. Journal of the American Statistical Association, 62(318), 399-402. https://doi.org/10.1080/01621459.1967.10482916
- Mishra, P., Pandey, C. M., Singh, U., Gupta, A., Sahu, C., & Keshri, A. (2019). Descriptive statistics and normality tests for statistical data. Annals of Cardiac Anaesthesia, 22(1), 67-72. https://doi.org/10.4103/aca.ACA_157_18
- NIST/SEMATECH. (n.d.). 1.3.5.16. Kolmogorov-Smirnov goodness-of-fit test. In e-Handbook of statistical methods. https://www.itl.nist.gov/div898/handbook/eda/section3/eda35g.htm
- Razali, N. M., & Wah, Y. B. (2011). Power comparisons of Shapiro-Wilk, Kolmogorov-Smirnov, Lilliefors and Anderson-Darling tests. Journal of Statistical Modeling and Analytics, 2(1), 21-33.
This article is part of the MAAS Journal series for Vietnamese international postgraduate students and researchers. MAAS data analysis support is an advisory service; our mentors explain methods and review your work, and we do not write, submit, or guarantee the outcome of work on a student's behalf.
Not sure how this guide applies to your own case? Talk it through with MAAS in a free 20-minute consultation.
book one here ▸