
◆ Research Methods
What does Levene's test tell you, and what if it is significant?
Direct answer: Levene's test checks whether two or more groups have equal variances, an assumption behind Student's t-test and classic ANOVA. A non-significant result (p above .05) means you have no evidence against equal variances. A significant result (p at or below .05) gives evidence that the population variances differ, so you report Welch's version of the test instead.
◆ Question 1 / 8 · What it tells you
What does Levene's test tell you?
Direct answer: Levene's test tells you whether the spread of scores is similar across your groups. The null hypothesis says every group has the same population variance, and the alternative says at least one pair of groups differs. The NIST/SEMATECH (n.d.) handbook calls this property homogeneity of variance.
Howard Levene proposed the test in 1960, and the NIST/SEMATECH (n.d.) e-Handbook of Statistical Methods still uses his paper as the starting point. The handbook explains that some statistical tests, for example the analysis of variance, assume that variances are equal across groups, and that Levene's test can be used to verify that assumption. In practice, you meet the test as a gatekeeper. Before you compare the average scores of two teaching methods, two cohorts or three regions, you check that the groups are not wildly different in how scattered their scores are. If one group's scores cluster tightly around the mean while another group's scores sprawl across the scale, the pooled calculation inside Student's t-test treats the two as if they were alike, and the resulting p-value can mislead. Levene's test puts a number on that worry, so you can decide which version of your main test to report rather than guessing from a boxplot alone.
◆ Question 2 / 8 · The formula
How is Levene's test calculated?
Direct answer: Levene's test turns each score into its absolute distance from its group's centre, then runs a one-way ANOVA on those distances. If one group's distances are larger on average, that group is more spread out. The result is an F-type statistic, W, compared against an F distribution with k − 1 and N − k degrees of freedom.
The NIST/SEMATECH (n.d.) handbook gives the formula in full. For a sample of N observations split into k groups, each score becomes a deviation Z, and W compares the variation of the group means of Z with the variation of Z within groups, in the same way an ANOVA compares group means. Delacre et al. (2017) describe the same idea in words: the test is the one-way ANOVA computed on the absolute differences between each observation and the centre of its group. The test rejects equal variances when W is larger than the upper critical value of the F distribution at your chosen significance level. The handbook's worked example uses ten batches of ten gear measurements, 100 values in all, so the degrees of freedom are 9 and 90. With W = 1.705910 against a critical value of 1.9855 at α = .05, the handbook concludes there is insufficient evidence to claim that the variances are not equal. You will rarely calculate W by hand, but knowing that it is an ANOVA on distances explains why it behaves like other F tests.
◆ Question 3 / 8 · Mean or median
Should the centre be the mean, the median or a trimmed mean?
Direct answer: Levene's original paper used the mean, and Brown and Forsythe (1974) added the median and the trimmed mean. The median version is the safest general choice for skewed data, and the mean version has the most power when data are symmetric. Software packages differ in their default, so always check which one you ran.
The choice of centre is the detail most students never notice, yet it changes the result. Brown and Forsythe (1974) ran simulation studies of the three options, and the NIST/SEMATECH (n.d.) handbook summarises them: the trimmed mean did best with heavy-tailed data, the median did best with skewed data, and the mean gave the best power for symmetric, moderate-tailed distributions. The handbook recommends the median as the choice that provides good robustness against many types of non-normal data while retaining good power. The SciPy documentation (SciPy Developers, n.d.) gives the same three recommendations and notes that the median and trimmed-mean versions are sometimes called the Brown-Forsythe test. The table below compares the three versions and the defaults the sources report.
| Centre used | Proposed by | Best suited to | Default in |
|---|---|---|---|
| Mean | Levene (1960) | Symmetric, moderate-tailed data | SPSS (Delacre et al., 2017) |
| Median | Brown and Forsythe (1974) | Skewed (non-normal) data | R and SciPy (Delacre et al., 2017; SciPy Developers, n.d.) |
| Trimmed mean (10% in NIST, 5% in SciPy) | Brown and Forsythe (1974) | Heavy-tailed data | Not a default in these sources |
Because SPSS centres on the mean while R and SciPy centre on the median, the same data can give slightly different p-values in different packages. Name the version in your methods section so a marker can reproduce it.
◆ Question 4 / 8 · SPSS output
How do you read Levene's test in SPSS?
Direct answer: In the Independent Samples Test table, read the Sig. value under Levene's Test for Equality of Variances. If it is above .05, report the row labelled "Equal variances assumed". If it is .05 or below, report the row labelled "Equal variances not assumed", which is Welch's t-test with adjusted degrees of freedom.
Significance threshold
.05
the conventional cut-off for the Sig. value in the Levene columns
Rows of t-test results
2
in the SPSS Independent Samples Test table
Reading Levene's test in SPSS
Tap a step to see what it does.
Step 1 / 3
Find the Levene columns
In the Independent Samples Test table, read the Sig. value under Levene's Test for Equality of Variances. From SPSS Statistics version 31 the test must be requested.
Step 2 / 3
Above .05
No evidence against equal variances, so report the row labelled Equal variances assumed.
Step 3 / 3
.05 or below
The variances differ, so report the row labelled Equal variances not assumed, which is Welch's t-test with adjusted degrees of freedom.
Save this figure
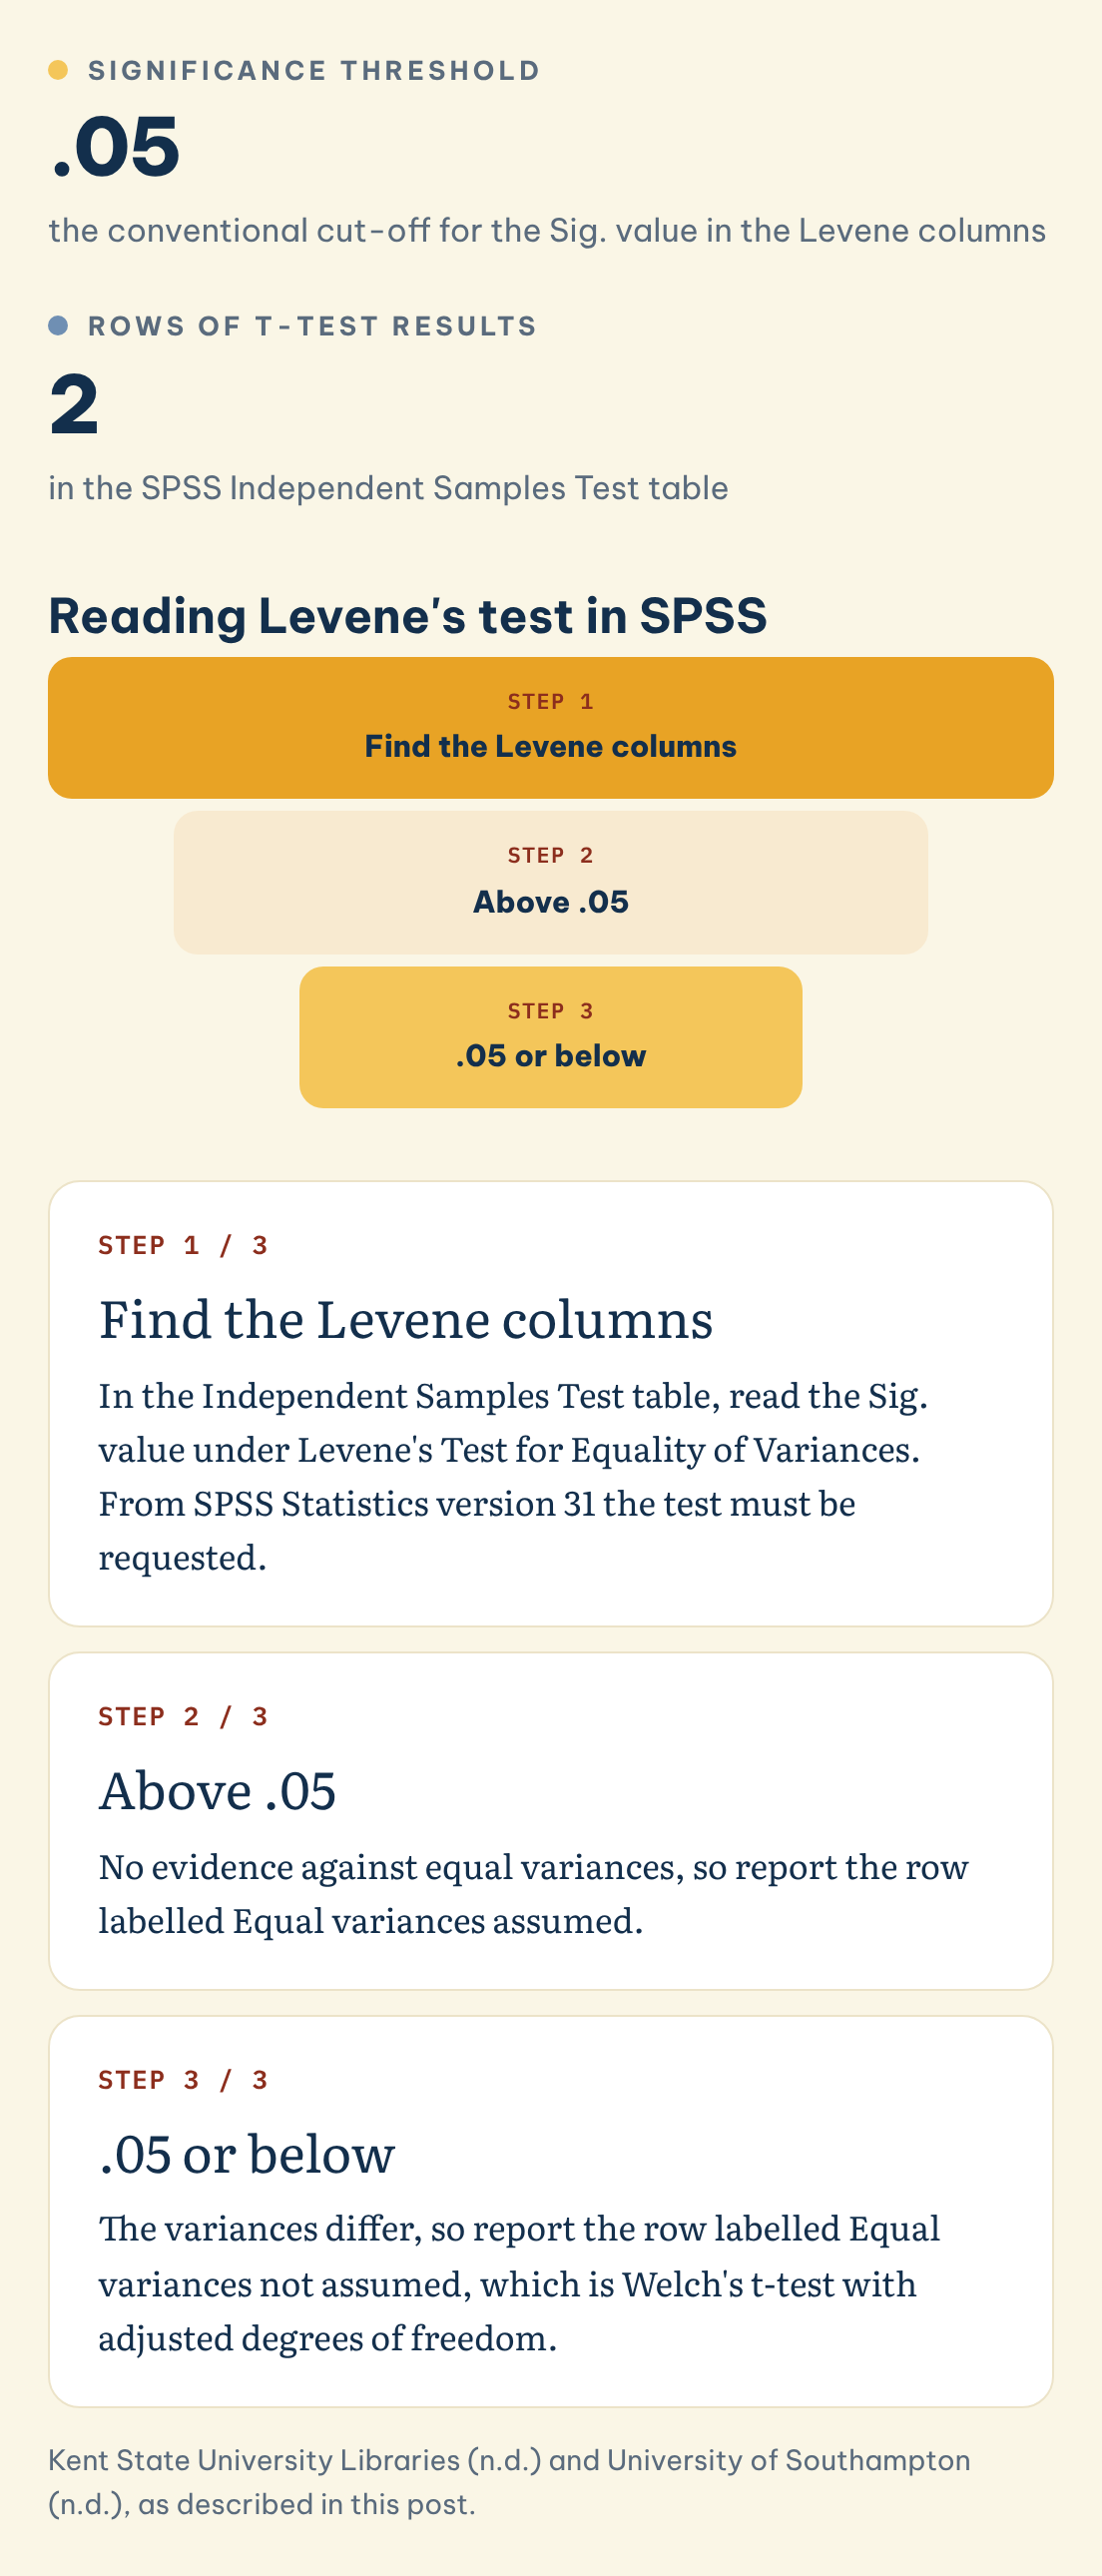
Kent State University Libraries (n.d.) explain that the Independent Samples Test table gives two rows of t-test results, and that the second row uses un-pooled variances and a correction to the degrees of freedom. The University of Southampton (n.d.) walks through the same table with a real example: Levene's p-value was reported as p = 0.000, well below the 0.05 threshold, so equal variance was not assumed and the p-value in the second row was used. Two practical warnings follow. First, the Sig. value in the Levene columns is not the result of your main test, so do not report it as your finding. Second, Kent State University Libraries (n.d.) note that from SPSS Statistics version 31, Levene's test is optional output that must be requested, whereas earlier versions produced it automatically. In version 31 or later, missing Levene columns usually mean the option was not ticked. For a comparison of three or more groups, the same check is usually offered alongside the ANOVA, and most packages also offer a Welch-type ANOVA.
◆ Question 5 / 8 · If significant
What should you do if Levene's test is significant?
Direct answer: A significant Levene's test suggests the equal-variance assumption does not hold. For two groups, report Welch's t-test, which SPSS prints as "Equal variances not assumed". For three or more groups, use a Welch-type ANOVA. Do not delete data to make the variances look equal.
A significant result is not a disaster, and it does not mean your study failed. It means the pooled formula behind Student's t-test is the wrong tool, and an alternative that does not pool the variances is available in the same output. Delacre et al. (2017) state the conventional rule plainly: if the test of the equality of variances is significant, Welch's t-test should be used instead of Student's t-test because the assumption of equal variances is violated. Kent State University Libraries (n.d.) describe Welch's statistic as an approximate t statistic that is not based on assuming equal population variances, and note that it is also known as the unequal variance or separate variances t test. When you write up the result, give the Levene statistic, its degrees of freedom and its p-value in one sentence, then report the Welch result with its adjusted, usually non-integer, degrees of freedom. Rounding those degrees of freedom is a common convention, but check your department's style guide first.
◆ Question 6 / 8 · Welch by default
Should you run Levene's test at all, or always use Welch?
Direct answer: Many methodologists now argue you can skip the two-step routine and report Welch's t-test by default. Delacre et al. (2017) show that Levene's test often has too little power to detect unequal variances in typical sample sizes, which makes the "test first, choose second" approach unreliable.
The argument against the two-step procedure is worth knowing, because a supervisor or examiner may raise it. Delacre and colleagues (2017) wrote that "Levene's test is more robust than Bartlett's test and the F-ratio test, but there are three arguments against the use of Levene's test" (p. 93). The first is that several versions exist and the best one depends on the shape of the data. The second is that choosing the t-test on the basis of Levene's result makes the error rates of the final test depend on the power of Levene's test. The third is low power: in their simulations, when one group's standard deviation was twice the other's, approximately 50 subjects in each group were needed to have 80 percent power to detect the difference (p. 94). Their recommendation is that "Welch's t-test should be used as a default strategy" (p. 92). If your course still teaches the two-step routine, follow it, and consider adding a sentence that Welch's result is reported because it does not rely on equal variances.
◆ Question 7 / 8 · ANOVA vs Levene
What is the difference between ANOVA and Levene's test?
Direct answer: ANOVA compares group means, while Levene's test compares group spreads. Levene's test is itself an ANOVA, run on each score's distance from its group centre instead of on the raw scores. You usually run Levene's test as an assumption check before or alongside the ANOVA on your actual outcome.
The confusion is understandable, because both tests produce an F-type statistic and both appear in the same SPSS dialogue. The NIST/SEMATECH (n.d.) handbook frames Levene's test as a way to verify the equal-variance assumption that the analysis of variance makes, and Delacre et al. (2017) describe its calculation as a one-way ANOVA on absolute deviations. In a dissertation chapter, the two therefore play different roles. The ANOVA on your outcome answers your research question about differences in average scores. Levene's test answers a technical question about whether the conditions for the classic ANOVA hold. Report the assumption check briefly in your results or methods section, and give the main analysis the space and interpretation. If your groups differ greatly in size as well as spread, mention that too, since unequal group sizes make the pooled approach more fragile. Our guide to choosing the right statistical test shows where this check sits in the wider decision.
◆ Question 8 / 8 · R and Python
How do you run Levene's test in R or Python?
Direct answer: In Python, call scipy.stats.levene() with one array per group, and it returns the statistic and the p-value. Its default centre is the median. Delacre et al. (2017) note that R also centres on the median by default, so set the centre to the mean if you need to match SPSS output exactly.
The SciPy Developers (n.d.) documentation lists the three options for the center argument, mean, median and trimmed, and states that the default is the median. A one-line call such as levene(group_a, group_b, center='mean') reproduces the SPSS version, which is useful when you need your Python figures to match a supervisor's SPSS output. Delacre et al. (2017) note that in R the centre is by default the median, which is also called the Brown-Forsythe test for equal variances. Whichever language you use, write the version into your methods section: "Homogeneity of variance was assessed with Levene's test centred on the median (Brown & Forsythe, 1974)" is a complete and checkable sentence. If you need a second pair of eyes on output from SPSS, R or Python, MAAS data analysis support works through your results with you, explains which row and which test to report, and leaves the interpretation and the write-up in your hands.
Frequently asked questions
What p-value means Levene's test is significant?
By convention, p at or below .05. The NIST/SEMATECH (n.d.) handbook frames the decision as rejecting equal variances when W exceeds the critical F value at your chosen significance level, so use the alpha your course specifies.
Is a non-significant Levene's test good?
It means you found no evidence that the variances differ, so the equal-variance row of the output is appropriate. It does not prove the variances are equal, and Delacre et al. (2017) warn the test often has low power in small samples.
What is the Brown-Forsythe test?
It is Levene's test centred on the median or a trimmed mean instead of the mean. Brown and Forsythe (1974) introduced these versions, and the SciPy Developers (n.d.) documentation notes the median and trimmed versions are sometimes called the Brown-Forsythe test.
Does Levene's test assume normality?
It is designed to be less sensitive to non-normality than Bartlett's test, according to the NIST/SEMATECH (n.d.) handbook. The median version is the recommended choice for skewed data.
Why is there no Levene's test in my SPSS output?
Kent State University Libraries (n.d.) note that from SPSS Statistics version 31 the test is optional output that must be requested. Tick the option and run the analysis again.
How do I report Levene's test in APA style?
Give the statistic, both degrees of freedom and the p-value, for example F(1, 58) = 4.21, p = .045, then state which version of the main test you report. The numbers in this example are illustrative only.
References
Brown, M. B., & Forsythe, A. B. (1974). Robust tests for the equality of variances. Journal of the American Statistical Association, 69(346), 364-367. https://doi.org/10.1080/01621459.1974.10482955
Delacre, M., Lakens, D., & Leys, C. (2017). Why psychologists should by default use Welch's t-test instead of Student's t-test. International Review of Social Psychology, 30(1), 92-101. https://doi.org/10.5334/irsp.82
Kent State University Libraries. (n.d.). Independent samples t test. SPSS Tutorials. https://libguides.library.kent.edu/SPSS/Independentttest
Levene, H. (1960). Robust tests for equality of variances. In I. Olkin (Ed.), Contributions to probability and statistics: Essays in honor of Harold Hotelling (pp. 278-292). Stanford University Press.
NIST/SEMATECH. (n.d.). Levene test for equality of variances. e-Handbook of Statistical Methods. https://www.itl.nist.gov/div898/handbook/eda/section3/eda35a.htm
SciPy Developers. (n.d.). scipy.stats.levene (Version 1.18.0). SciPy documentation. https://docs.scipy.org/doc/scipy/reference/generated/scipy.stats.levene.html
University of Southampton. (n.d.). T test. Practical Applications of Statistics in the Social Sciences. https://www.southampton.ac.uk/passs/gcse_scores/bivariate_analysis/t_test.page
Not sure how this guide applies to your own case? Talk it through with MAAS in a free 20-minute consultation.
Book a free consultation ▸