
◆ Research Methods
What is the difference between the null and alternative hypothesis?
The null hypothesis (H0) says there is no difference or no relationship in the population, and the alternative hypothesis (H1) says there is one. You test H0, not H1: if the p-value falls at or below your significance level, usually 0.05, you reject H0 in favour of H1, and otherwise you "fail to reject H0" (Gilchrist & Samuels, n.d.). You never prove either one.
◆ Question 1 / 8 · H0 and H1
What is the H0 and H1 hypothesis?
Direct answer: H0 is the null hypothesis, which states that there is no effect, difference or relationship in the population. H1, also written HA, is the alternative or research hypothesis, which states that there is one. Teesside University (n.d.) describes H1 as the hypothesis your study sets out to support.
H0 and H1 are both claims about the population, not about the sample you collected. The University of Sheffield (n.d.) explains that a hypothesis test begins by assuming H0 is true, and then asks whether the sample data are unusual enough to make that assumption hard to keep. This is why the two hypotheses must be written as exact opposites: between them they cover every possible state of the population, so rejecting one leaves only the other. A dissertation that states H1 without H0, or states two hypotheses that overlap, gives the examiner no clear decision rule to check. In practice you write your research hypothesis in words first, in the form your literature review supports, and then translate it into the paired statistical form that your chosen test can evaluate. If you have not yet written the research hypothesis itself, start with our research hypothesis examples, then use the guide on choosing the right statistical test to link the hypothesis to the design of your data.
◆ Question 2 / 8 · An example
What is a null hypothesis, with an example?
Direct answer: A null hypothesis is the statement of no effect that your test tries to disprove. For example, "There is no difference in mean exam scores between students who attend revision workshops and students who do not." The alternative would be "There is a difference in mean exam scores between the two groups."
The example above is non-directional, because H1 does not say which group scores higher. Teesside University (n.d.) explains that a non-directional hypothesis goes with a two-tailed test, while a directional hypothesis, such as "workshop attendees score higher", goes with a one-tailed test. The same source warns that a one-tailed test makes a significant result easier to obtain, and the University of Sheffield (n.d.) advises sticking with the default two-tailed test unless you have a good reason not to. Many supervisors prefer the two-tailed form for exactly this reason, because it is harder to accuse of being chosen after the fact. Whichever form you use, decide it in your methodology chapter and keep it unchanged in your results chapter. Changing from two tails to one tail after seeing a p-value of 0.07 is a choice an examiner can spot and will question.
◆ Question 3 / 8 · Symbols by test
What are the null hypothesis symbol and formula for common tests?
Direct answer: The null hypothesis is written H0 and usually contains an equals sign, such as μ1 = μ2 or ρ = 0. The alternative is written H1 or HA and uses ≠, > or <. The exact form depends on the test, so match the symbols to the parameter your test estimates.
The table below pairs each common dissertation test with its hypotheses in symbols and in words. The list of tests follows the statstutor leaflet by Gilchrist and Samuels (n.d.), which groups tests by the type of data and question. The symbol forms are the standard notation for each parameter; the wording is ours.
| Test | H0 in symbols | H1 in symbols (two-tailed) | H0 in words |
|---|---|---|---|
| Independent t-test | μ1 = μ2 | μ1 ≠ μ2 | The two group means are equal in the population |
| Paired t-test | μd = 0 | μd ≠ 0 | The mean difference between paired scores is zero |
| One-way ANOVA | μ1 = μ2 = μ3 | At least one mean differs | All group means are equal |
| Pearson correlation | ρ = 0 | ρ ≠ 0 | There is no linear relationship between the two variables |
| Spearman correlation | ρs = 0 | ρs ≠ 0 | There is no monotonic relationship between the two variables |
| Chi-squared test of independence | Variables independent | Variables associated | The two categorical variables are not associated |
Notice that the ANOVA alternative is "at least one mean differs", not "all means differ". Writing the stronger version is a common slip that makes your stated hypothesis different from the one your software actually tests.
◆ Question 4 / 8 · Why null
Why is it called a null hypothesis?
Direct answer: The term comes from the statistician R. A. Fisher, who used it in 1935 for the hypothesis that an experiment tries to nullify. Fisher (1935) wrote that "the null hypothesis is never proved or established, but is possibly disproved, in the course of experimentation."
Fisher (1935) went on to say that "every experiment may be said to exist only in order to give the facts a chance of disproving the null hypothesis." His famous example was a lady who claimed she could tell whether milk or tea had been poured into the cup first. With eight cups, four of each kind, the chance of naming all eight correctly by pure guessing is 1 in 70, about 1.4%, because there are 70 different ways to pick 4 cups out of 8. A perfect score would therefore be strong evidence against the null hypothesis that she was guessing. Fisher's own approach used only one hypothesis. Morimoto (2021) explains that the alternative hypothesis, along with the idea of accepting or rejecting between two rival statements, came later from Jerzy Neyman and Egon Pearson. The H0 and H1 pair you write in a dissertation today is a blend of the two traditions, which is one reason the wording of conclusions causes so much confusion.
◆ Question 5 / 8 · Why write H0
Why do you need to write a null hypothesis at all?
Direct answer: You write a null hypothesis because statistical tests can only calculate how surprising your data would be if H0 were true. Without a precise H0, there is nothing for the p-value to refer to, and no clear rule for deciding whether your result supports H1.
A p-value is a conditional probability: it is calculated on the assumption that H0 holds. The University of Sheffield (n.d.) frames the whole test this way, starting from the assumption that H0 is true and asking whether the evidence is strong enough to reject it. If your H0 is vague, for example "students' attitudes will not change much", no test can produce a p-value for it, because "much" has no number attached. Writing H0 precisely therefore forces you to commit to the parameter, the groups and the direction before you analyse anything. That commitment is also what protects you against the charge of changing your question to fit your results. Many universities ask for both hypotheses in the methodology chapter so that the examiner can check the analysis against what you planned to test.
◆ Question 6 / 8 · Fail to reject
What does "fail to reject the null hypothesis" mean?
Direct answer: Failing to reject H0 means your data were not surprising enough, at your chosen significance level, to rule out H0. It does not mean H0 is true. Gilchrist and Samuels (n.d.) compare it to "acquitting a defendant when there is insufficient evidence", rather than declaring them innocent.
The University of Sheffield (n.d.) is direct about the wording: "By convention, we never say that we 'accept' a hypothesis." The reason is that a non-significant result has several possible causes. There may be no effect, or there may be a real effect that your sample was too small to detect. Wasserstein et al. (2019) put the warning plainly: "Don't believe that an association or effect is absent just because it was not statistically significant" (p. 1). In your results chapter, a safe sentence is "The difference was not statistically significant, so we failed to reject H0", followed by the effect size and its confidence interval. Gilchrist and Samuels (n.d.) also note that statistical significance does not necessarily indicate practical usefulness, so a significant result still needs an effect size before you can say it matters. Our guide on reporting effect sizes and confidence intervals shows the format.
◆ Question 7 / 8 · Type I and II
What are Type I and Type II errors in hypothesis testing?
Direct answer: A Type I error is rejecting H0 when it is actually true, a false positive. A Type II error is failing to reject H0 when it is actually false, a false negative. Your significance level, usually 0.05, is the Type I risk you accept before the analysis begins.
Teesside University (n.d.) explains that a significance level of 0.05 means a 5% chance, or 1 in 20, of concluding there is an effect when there is none, and that the level should be set before you analyse the data. In other words, if you ran 100 tests where H0 was true, you would expect about 5 of them, or 5%, to come out significant by chance alone. The two errors pull against each other. Gilchrist and Samuels (n.d.) point out that lowering the significance level to 0.001, a 0.1% risk, reduces the Type I risk but raises the Type II risk, so a very strict threshold makes real effects harder to find. The probability of avoiding a Type II error is called power, written 1 − β. The table summarises the four possible outcomes, which both the University of Sheffield (n.d.) and Gilchrist and Samuels (n.d.) set out in similar tables.
| H0 is actually true | H0 is actually false | |
|---|---|---|
| You reject H0 | Type I error (false positive) | Correct decision |
| You fail to reject H0 | Correct decision | Type II error (false negative) |
A power analysis before data collection tells you how large a sample you need to keep the Type II risk acceptable. If your study is already finished and underpowered, say so in your limitations section rather than treating a non-significant result as evidence of no effect.
◆ Question 8 / 8 · In your dissertation
How do you write both hypotheses in your dissertation?
Direct answer: State your research hypothesis in words in the literature review or methodology, then give the paired H0 and H1 for each test, name the test and significance level, and report the decision in the results chapter using "reject" or "fail to reject". Keep the wording identical across chapters.
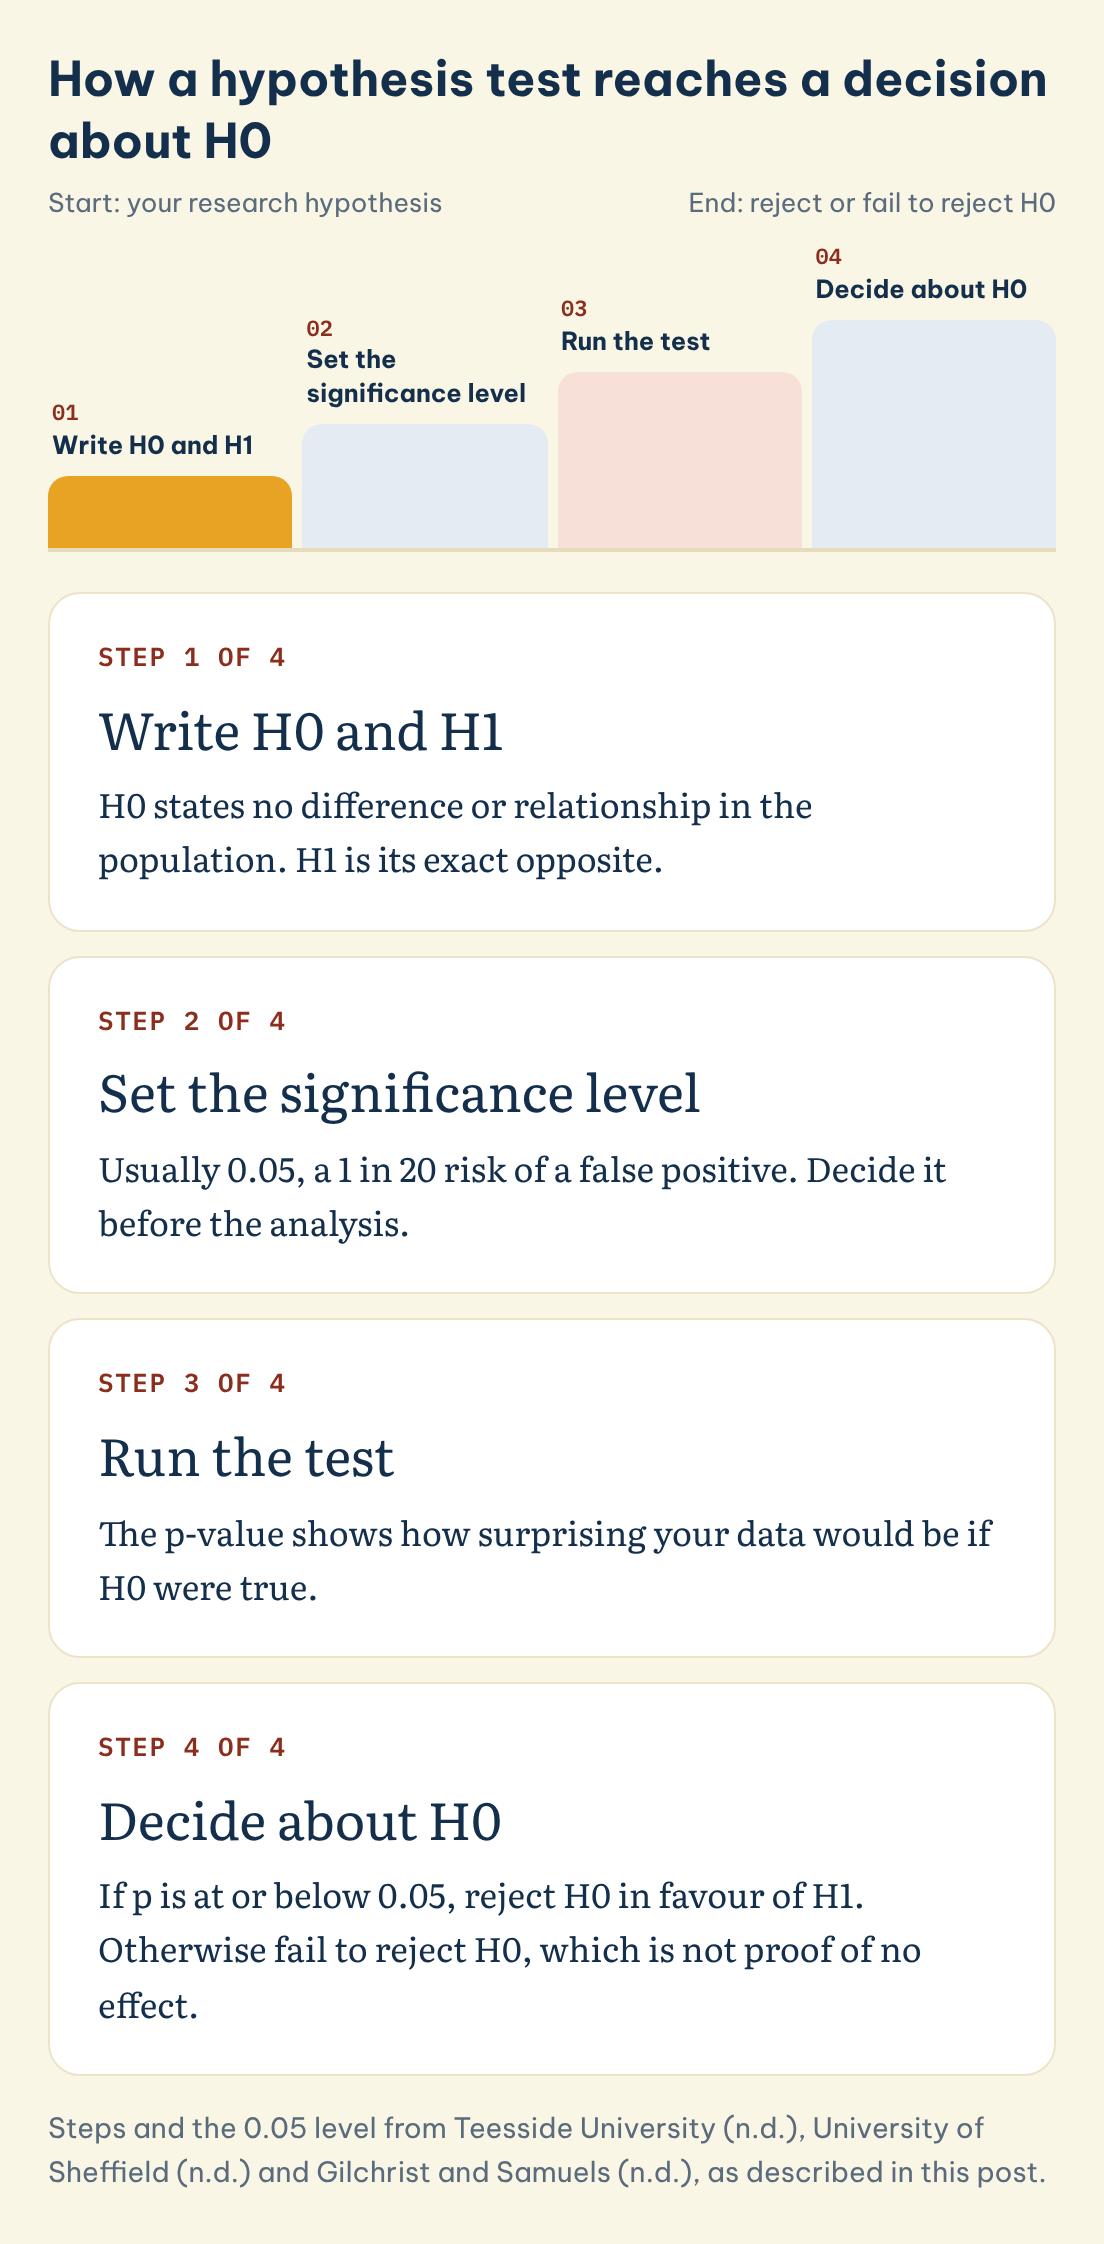
How a hypothesis test reaches a decision about H0
Tap a step to see what it asks of you.
Step 1 of 4
Write H0 and H1
H0 states no difference or relationship in the population. H1 is its exact opposite.
Step 2 of 4
Set the significance level
Usually 0.05, a 1 in 20 risk of a false positive. Decide it before the analysis.
Step 3 of 4
Run the test
The p-value shows how surprising your data would be if H0 were true.
Step 4 of 4
Decide about H0
If p is at or below 0.05, reject H0 in favour of H1. Otherwise fail to reject H0, which is not proof of no effect.
Save this figure
A clear sequence looks like this. First, in the methodology, write each research question, then its H0 and H1 in words, then the test you will use and the significance level, decided in advance as Teesside University (n.d.) recommends. Second, number the hypotheses (H1a, H1b and so on) if you have several, so that each result can be traced back. Third, in the results chapter, report the test statistic, degrees of freedom, p-value and effect size, then state the decision about H0 in one sentence. Fourth, in the discussion, interpret what the decision means for your research question, remembering that failing to reject H0 is not proof of no effect. If you are running the analysis in SPSS, R or Python and are unsure whether your hypotheses match the test output, SPSS, R and Python help from MAAS pairs you with an expert who explains each step of the analysis while the decisions and the write-up stay yours.
Frequently asked questions
Can the null hypothesis be directional?
Yes. For a one-tailed test, H0 is written with ≤ or ≥, for example μ1 ≤ μ2, and H1 takes the opposite strict direction, μ1 > μ2. Teesside University (n.d.) links directional hypotheses to one-tailed tests.
Is the alternative hypothesis the same as my research hypothesis?
Usually. Teesside University (n.d.) treats H1 as the research or experimental hypothesis. Your research hypothesis may be written more descriptively, while H1 is its precise statistical form.
Can I accept the alternative hypothesis?
Say that you reject H0 in favour of H1, the wording Gilchrist and Samuels (n.d.) use for a significant result. Avoid "prove" or "accept", because a test gives evidence, not certainty.
What p-value do I need to reject the null hypothesis?
The usual threshold is p ≤ 0.05 (Gilchrist & Samuels, n.d.), but your department or field may require 0.01, which cuts the Type I risk from 5% (1 in 20) to 1% (1 in 100). Set the level before the analysis and report the exact p-value.
Do qualitative dissertations need a null hypothesis?
No. Null and alternative hypotheses belong to statistical testing. A qualitative study works from research questions instead.
How many hypotheses should a dissertation have?
There is no fixed number. Write one H0 and H1 pair for each statistical test that answers a research question, and number them so each result is traceable.
References
Fisher, R. A. (1935). The design of experiments. Oliver and Boyd.
Gilchrist, M., & Samuels, P. (n.d.). Statistical hypothesis testing [statstutor community project leaflet]. statstutor. https://www.statstutor.ac.uk/resources/uploaded/statisticalhypothesistesting3.pdf
Morimoto, R. (2021). Stop and think about p-value statistics: Fisher, Neyman, and E. Pearson revisited. Annals of the Japan Association for Philosophy of Science, 30, 43–65. https://doi.org/10.4288/jafpos.30.0_43
Teesside University. (n.d.). Testing hypotheses. Quantitative data collection and analysis LibGuide. https://libguides.tees.ac.uk/quantitative/testing
University of Sheffield. (n.d.). Introduction to hypothesis tests. Maths and Statistics Help (MASH). https://sheffield.ac.uk/mash/stats-resources/hypothesis
Wasserstein, R. L., Schirm, A. L., & Lazar, N. A. (2019). Moving to a world beyond "p < 0.05". The American Statistician, 73(sup1), 1–19. https://doi.org/10.1080/00031305.2019.1583913
Not sure how this guide applies to your own case? Talk it through with MAAS in a free 20-minute consultation.
Book a free consultation ▸