
◆ Marketing
MKTG3110 Digital Marketing: the consumer journey is a model
The unit asks you to understand the digital consumer journey, and the phrase sounds like a description of something real. It is a model. That distinction is the difference between an assignment that reports a journey and one that argues for a journey, and third-year marking, in a unit worth 6 credit points, separates the two ruthlessly. Students who spend their word count drawing the journey lose marks that students who spend it defending the journey win.
◆ Section 1 / 8 · What the unit is
What is the unit, and how is it pitched?
Direct answer: At the University of Sydney, founded in 1850, MKTG3110 is Digital Marketing, a 6 credit point undergraduate unit in the Business School, with MKTG1001 as the prerequisite. The published description centres it on how marketing campaigns are designed, conceptualised and executed digitally, with attention to techniques unique to digital technologies and to the networked nature of social media platforms.
Evidence: The description then names where those techniques are applied, which is brand building, target audiences, public relations and communications, with the stated aim of equipping students to understand the digital consumer journey. That last clause, fewer than 15 words long, is the one worth reading twice, because it is the organising idea the assessment tends to hang on.
Warning on the code: MKTG3110 is also used at the University of North Carolina at Charlotte for an introductory marketing subject. Material circulating under that code is written for a first-year audience and will mislead you badly here. Check that anything you find matches the Sydney unit description before you use it.
Example: A student found a well-organised set of notes under this code and worked through them for 7 days, roughly 2 hours a day, before noticing they covered McCarthy's (1960) four Ps at introductory depth. The code matched. Nothing else did.
◆ Section 2 / 8 · Learning outcomes
Why do the learning outcomes read like a job description?
Direct answer: Because they were written that way. The published outcomes ask students to demonstrate skill sets that are in demand by industry, to apply theory to produce a professional business document, to apply theory and software to solve real-world problems, and to demonstrate an awareness of contemporary challenges in business and the need for ethical behaviour in the face of those challenges. Three of the four name an artefact or a tool rather than a mental operation.
Evidence: That phrasing changes what a strong submission looks like. Most marketing units assess whether you can analyse and evaluate. This one assesses whether you can produce something a workplace would accept, which sets a floor rather than a ceiling. The word doing the real work in two of the four outcomes is apply, and it is applied to theory, not to software. A polished deliverable with no theory in it satisfies the visible half of the outcome and fails the graded half.
Example: Two students submitted campaign documents of similar visual quality, both around 2,000 words. One explained each decision by pointing at what it was expected to achieve. The other explained each decision by pointing at a mechanism from the unit and saying why that mechanism predicted the result. The second had the same deliverable, drafted over the same 2 weeks, and a much better mark, because the outcome asks for theory applied, not theory listed.
◆ Section 3 / 8 · The consumer journey
What is the consumer journey actually claiming?
Direct answer: That customer experience can be usefully organised into stages, an idea Lemon and Verhoef (2016) formalised, and that what happens in one stage carries into the next. It is a framework for structuring analysis. It is not a claim that any individual consumer walks a path in that shape.
Evidence: Lemon and Verhoef (2016), writing in the Journal of Marketing, set out the journey as a process construct spanning 3 named stages, pre-purchase, purchase and post-purchase experience, and their framing is explicitly about organising a research and management agenda rather than about describing a route people take. The authors state that "will refer to the customer purchase journey as the process a customer goes through, across all stages and touch points, that makes up the customer experience" (Lemon & Verhoef, 2016, p. 71). Reading it that way is what allows you to ask the questions the unit rewards. Which touchpoints are under the firm's control and which are not? Which stage is the constraint for this brand? What would count as evidence that a stage is failing?
Example: Asked to map the journey for a client, a weaker answer produced an attractive diagram with 5 stages and icons. A stronger one produced 3 stages, justified the collapse by arguing that 2 of the conventional stages were indistinguishable for a low-involvement product, and named what evidence would overturn that decision. The second answer had less on the page and more argument in it.
◆ Section 4 / 8 · What data supports
What can the data actually support?
Direct answer: A dashboard alone rarely proves what a marketing claim needs. Confirming consumers pass through given stages needs behavioural data across touchpoints, confirming a channel caused conversions needs a randomised holdout, and confirming a creative outperformed another needs a controlled test holding the audience constant, not two numbers from mismatched campaigns.
What would establish each claim you want to make in MKTG3110
Each row sets one claim beside the evidence that would establish it, which a dashboard alone rarely gives you.
The claim you want to make
What would establish it
Consumers pass through these stages
Behavioural data across touchpoints, plus a stated rule for stage boundaries
This channel caused these conversions
A randomised holdout, or a design that handles selection
This creative outperformed that one
A controlled test with the audience held constant
Our audience is this segment
A sampling frame you can describe
Engagement predicts purchase
A link tested on outcomes, not on proxies
Save this figure
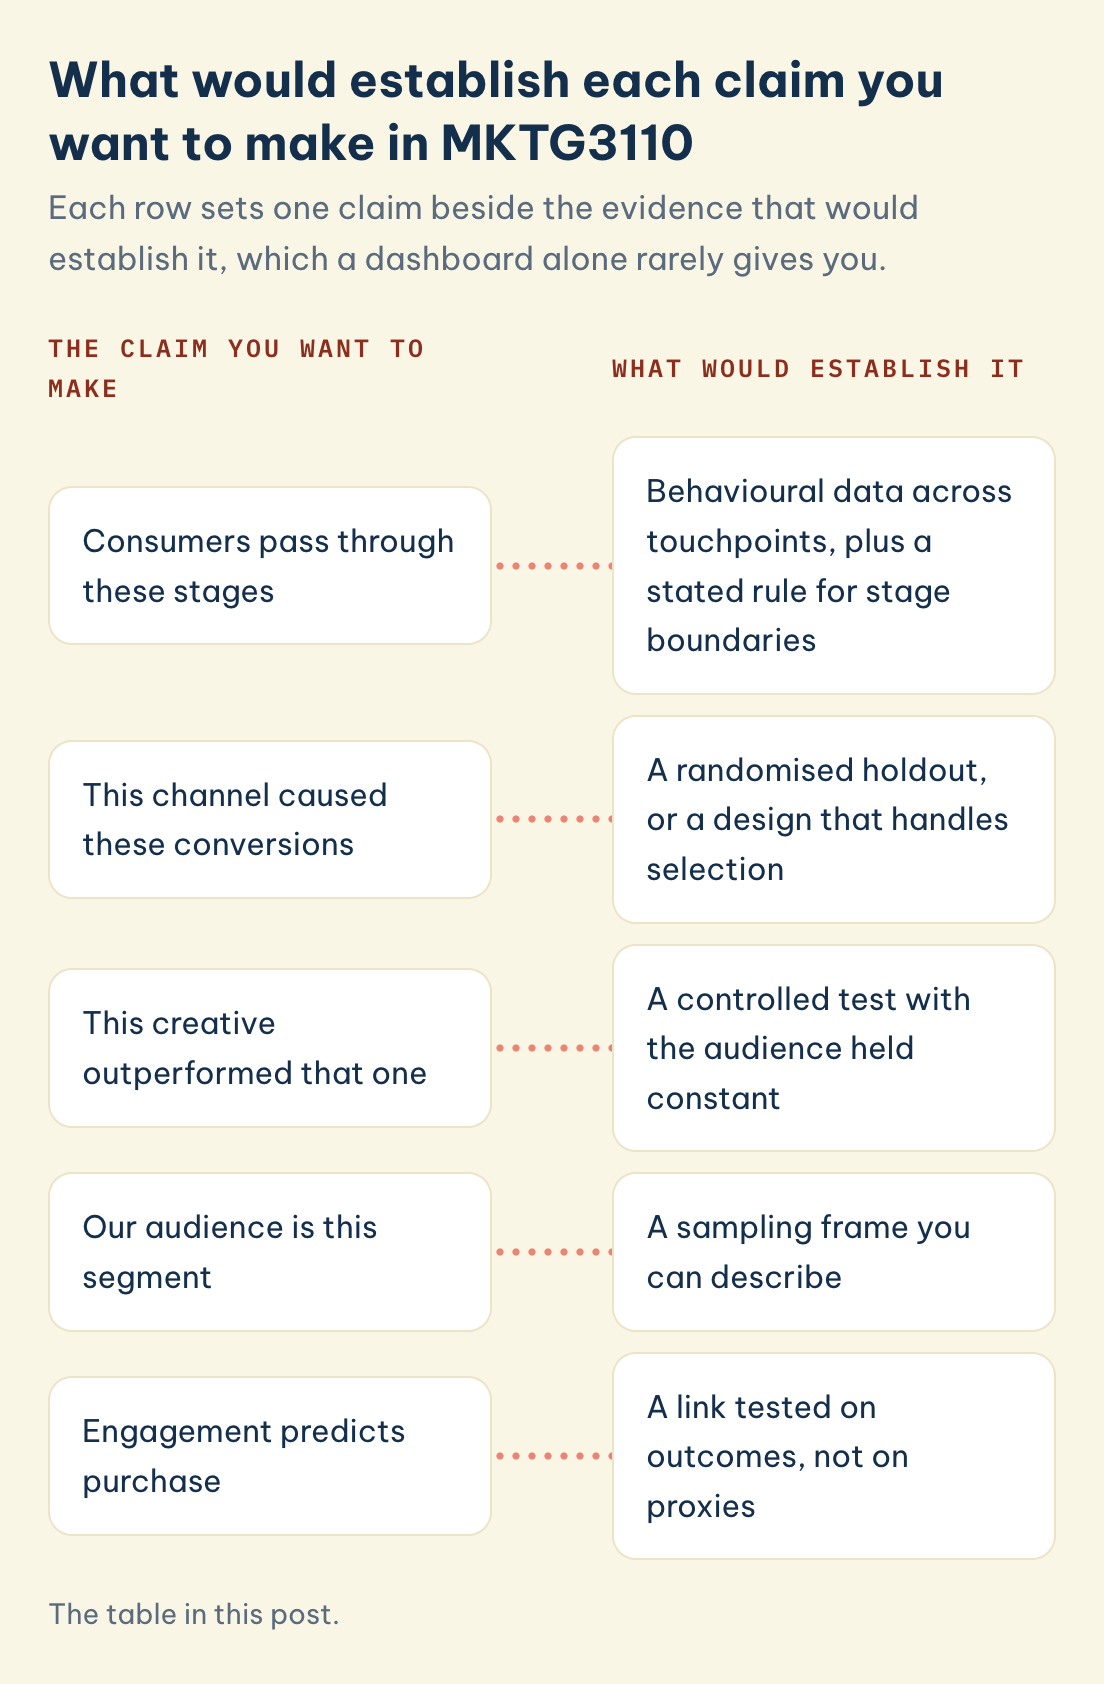
Sorting claims by what would be needed to establish them is the fastest way to stop a digital marketing assignment overclaiming.
| The claim you want to make | What would establish it | What a dashboard alone gives you |
|---|---|---|
| Consumers pass through these stages | Behavioural data across touchpoints, plus a stated rule for stage boundaries | A funnel visualisation whose stages were defined by the tool |
| This channel caused these conversions | A randomised holdout, or a design that handles selection | A correlation between exposure and conversion |
| This creative outperformed that one | A controlled test with the audience held constant | Two numbers from campaigns that did not face the same audience |
| Our audience is this segment | A sampling frame you can describe | The subset of people the platform chose to serve |
| Engagement predicts purchase | A link tested on outcomes, not on proxies | Engagement counts and purchase counts side by side |
◆ Section 5 / 8 · Attribution
Why does the attribution section usually overclaim?
Direct answer: Because the numbers a platform reports are observational, and the sentence students write about them is causal. The gap between the two is not a rounding error, and Gordon et al. (2019) treat it as a documented finding rather than a matter of caution.
Evidence: Gordon, Zettelmeyer, Bhargava and Chapsky (2019), published in Marketing Science, compared experimental and observational estimates using 15 large-scale US advertising experiments run on Facebook, covering roughly 500 million user-experiment observations and 1.6 billion ad impressions. They report that the observational approaches ordinarily available to advertisers often fail to recover the causal effect that the randomised experiments identify. The finding that matters for your assignment is not simply that the observational numbers were wrong, but that the size and direction of the error varied across campaigns, which means no rule of thumb corrects it.
Evidence, second layer: The modelling literature is not more optimistic in a different way, it is more precise about the conditions. Li and Kannan (2014), in the Journal of Marketing Research, built a model of conversion attribution across channels and validated it against a field experiment rather than against the model's own fit, which is the standard worth noticing. Anderl, Becker, von Wangenheim and Schumann (2016), in the International Journal of Research in Marketing, took a graph-based approach to journey and attribution modelling and drew out how much the resulting picture depends on the modelling choices made before the data is touched.
Example: A student, in the final week of a semester of 13 weeks, wrote that paid social drove a 34% lift in conversions. The dashboard did say that number. What it had measured was the conversion rate among people the platform selected to show the ad to, compared with people it did not. The number was real and the sentence around it was not. A short paragraph of around 40 words, naming that limitation, would have turned a marked-down claim into a demonstration of judgement.
◆ Section 6 / 8 · Using software
How do you use software output without letting it write your argument?
Direct answer: By deciding what you want to know before you open the tool, and by writing the interpretation, usually 2 to 3 sentences, in your own words rather than in the tool's vocabulary. The outcome says apply theory and software. Software that arrives without theory reads as a screenshot with a caption.
Evidence: Platform metrics are defined by the platform, and the definitions carry assumptions that your argument then inherits without stating them. An impression, a reach figure, a session and an engagement are each a measurement decision made by someone else for their own purposes. Naming the definition you are relying on, in around 10 words, is a small move that separates a third-year answer from a first-year one.
Example: Vietnamese students often arrive with genuinely strong practical skill in these tools, sometimes stronger than their classmates', and are surprised when the polished output marks lower than expected. The gap is rarely technical. It is that the analysis narrates what the dashboard displayed instead of arguing what the display means, and the fix adds roughly 25 words per figure: what this number is, what it cannot tell us, and what follows for the decision.
◆ Section 7 / 8 · The ethics outcome
Where does the ethics outcome actually bite?
Direct answer: Most often at measurement, not at content. Students expect the ethical question to be about what a campaign says, and spend around 50 words on it. In a digital unit it is at least as often about what the campaign collects and how confidently the results are reported.
Evidence: A claim presented with more certainty than the method supports, often in a single overreaching sentence of under 30 words, is a reporting problem before it is a moral one, and the outcome's wording links ethical behaviour to contemporary challenges in business rather than to advertising content alone. Treating honest measurement as part of the ethics outcome rather than as a separate methodological aside tends to produce a more coherent answer than bolting a paragraph about privacy onto the end.
Note on scope: how heavily each outcome is weighted, and which assessment task carries it, changes between teaching periods, sometimes within 6 months. The unit outline for your own semester is the authority on task structure and weighting. Nothing here substitutes for reading it.
Example: Asked to address ethics in a campaign proposal, a weaker answer added a closing paragraph of about 80 words on data privacy that connected to nothing above it. A stronger one revised its own results section, restating 2 claims in about 40 words at the confidence the evidence supported, and said that was the ethical decision the brief actually required.
◆ Section 8 / 8 · Order of work
A practical order of work
Direct answer: State the question a campaign answers in 20 words or fewer before choosing a channel, then build the journey model deliberately across 3 to 5 stages. Separate description from inference in short sentences, name the design, such as a holdout test, that would establish any causal claim, and read the draft as an employer, then as a marker.
- Decide what question the campaign is answering, in 20 words or fewer, before you choose a channel. The channel is a means and marks follow the reasoning.
- Build the journey model deliberately, typically 3 to 5 stages. State the stages you are using, why those and not others, and what would make you revise them.
- For each number you plan to report, write in a clause of around 15 words what it measures and who defined it.
- Separate description from inference, ideally in 3 sentences of 15 to 20 words each. Say what happened, then say what you infer, then say what would have to be true for the inference to hold.
- Where you cannot establish a causal claim, say so directly and name the design, such as a holdout test, that would establish it. This scores better than an unqualified assertion.
- Read the deliverable back as an employer would, then as a marker would. The outcomes ask you to satisfy both, and only the second one reads your justification.
Frequently asked questions
Which institution does this unit belong to?
The University of Sydney, founded in 1850, where MKTG3110 is Digital Marketing, a 6 credit point Business School unit. The same code is used at the University of North Carolina at Charlotte for an introductory subject, so confirm the unit description before trusting any material you find.
What do I need to have passed first?
The unit page lists MKTG1001 as the prerequisite, and like MKTG3110 itself it is typically worth 6 credit points. Prerequisites are restated each year, so check the page for your own year of enrolment rather than an archived handbook.
What are the assessment tasks and weightings?
Task structure and weighting vary between teaching periods, sometimes within 12 months of each other, and are set out in your unit outline. Weightings circulating on student-notes sites are frequently out of date, and building a work plan on them is a risk you do not need to take.
Is this a technical unit?
It is applied rather than technical. Two of the 4 published outcomes ask you to apply theory and software to real problems, which means tool competence is expected but is not what the marks are given for.
How much theory belongs in a campaign document?
Enough that every substantive decision, roughly 1 per 200 words, can be traced to a mechanism rather than to preference. A professional document does not stop being theoretical, it stops being explicit about its theory, and the outcome asks you to stay explicit.
Can I use platform-reported lift figures as evidence?
You can report them, and you should say what they are, usually in 20 to 30 words. Presenting an observational platform figure as a measured causal effect is the single most common overclaim in digital marketing assignments, and naming the limitation is usually rewarded rather than penalised.
Related reading
Where MAAS fits
MAAS mentors work alongside students on units like this rather than in place of them. In digital marketing the most useful review is usually a reading pass over the claims: taking each figure in the draft and asking what it measures, who defined it, and whether the sentence built on it is doing more work than the evidence allows. Students frequently find their campaign thinking was sound and their reporting was overconfident, which is a fixable problem and a cheap one to fix before submission rather than after. The work stays yours. If that is useful, our academic support service and our tutoring service are the two places to start.
References
Anderl, E., Becker, I., von Wangenheim, F., & Schumann, J. H. (2016). Mapping the customer journey: Lessons learned from graph-based online attribution modeling. International Journal of Research in Marketing, 33(3), 457–474. https://doi.org/10.1016/j.ijresmar.2016.03.001
Gordon, B. R., Zettelmeyer, F., Bhargava, N., & Chapsky, D. (2019). A comparison of approaches to advertising measurement: Evidence from big field experiments at Facebook. Marketing Science, 38(2), 193–225. https://doi.org/10.1287/mksc.2018.1135
Lemon, K. N., & Verhoef, P. C. (2016). Understanding customer experience throughout the customer journey. Journal of Marketing, 80(6), 69–96. https://doi.org/10.1509/jm.15.0420
Li, H., & Kannan, P. K. (2014). Attributing conversions in a multichannel online marketing environment: An empirical model and a field experiment. Journal of Marketing Research, 51(1), 40–56. https://doi.org/10.1509/jmr.13.0050
McCarthy, E. J. (1960). Basic marketing: A managerial approach. Richard D. Irwin.
Tools & resources
The University of Sydney. (2026). MKTG3110: Digital Marketing. https://www.sydney.edu.au/units/MKTG3110
The University of Sydney. (2026). Unit of study outlines. https://www.sydney.edu.au/students/unit-of-study-outlines.html
A free 20-minute consultation is a conversation about where you are with MKTG3110.
Book a free consultation ▸