
◆ Marketing
MKTG1420 Digital Business Development: how do you approach it?
The riskiest source for an MKTG1420 assignment is a blog post titled "10 SEO tips that still work". Search is being reshaped by AI-generated answers, and tactics written for an old ranking environment will date the work before it is marked. The marker is not testing whether students know the current tips; they are testing whether students can justify an optimisation decision with data. This guide answers the seven questions Vietnamese students ask MAAS mentors.

◆ Question 1 / 7 · What MKTG1420 is
What is MKTG1420 and how technical is it?
Direct answer: MKTG1420 is RMIT's course code for Digital Business Development, delivered to undergraduates at RMIT Vietnam Saigon South, within the Bachelor of Digital Marketing. It is more technical than most marketing courses, covering ecommerce, website management, e-CRM, e-supply chain, and search engine marketing including SEO, link building, and tracking outcomes. The Hanoi equivalent is MKTG1428.
Evidence: RMIT's handbook record 052668 sets out that scope, and the course learning outcomes require you to understand the principles of the digital information network, use internet tools strategically to attract and retain consumers, explain how an internet marketing strategy fits an organisation's overall marketing framework including its performance metrics, engage in SEO, search engine marketing and website design to optimise customer experience, and design an internet marketing strategy with an implementation plan.
Example: A student who had done well in campaign-focused marketing courses assumed this one would reward the same writing. Her first draft argued for brand positioning and never once mentioned a metric. Her mentor pointed at CLO3, which names performance metrics explicitly. The rewrite kept her positioning argument but tied every claim to something measurable.
◆ Question 2 / 7 · Tasks and marks
What are the assessment tasks, and where do marks concentrate?
Direct answer: The Vietnam class guide for this course sets out three tasks: a Digital Business Analysis Report worth 30%, a second task worth 30%, and an E-commerce UX, Analytics and Optimisation task worth 40%. The weighting tells you where to spend your effort: the final task, which asks you to work with a real ecommerce interface, interpret analytics and justify optimisations, carries the most marks and is where vague recommendations are punished hardest. Confirm your own tasks and weightings in Canvas, since class guides are specific to a teaching period.
How the three MKTG1420 tasks are weighted in the RMIT Vietnam class guide
The yellow part is the final task, which carries the most marks.
Digital Business Analysis Report
30
% of the marks
Second task
30
% of the marks
E-commerce UX, Analytics and Optimisation task (final task)
40
% of the marks
Save this figure
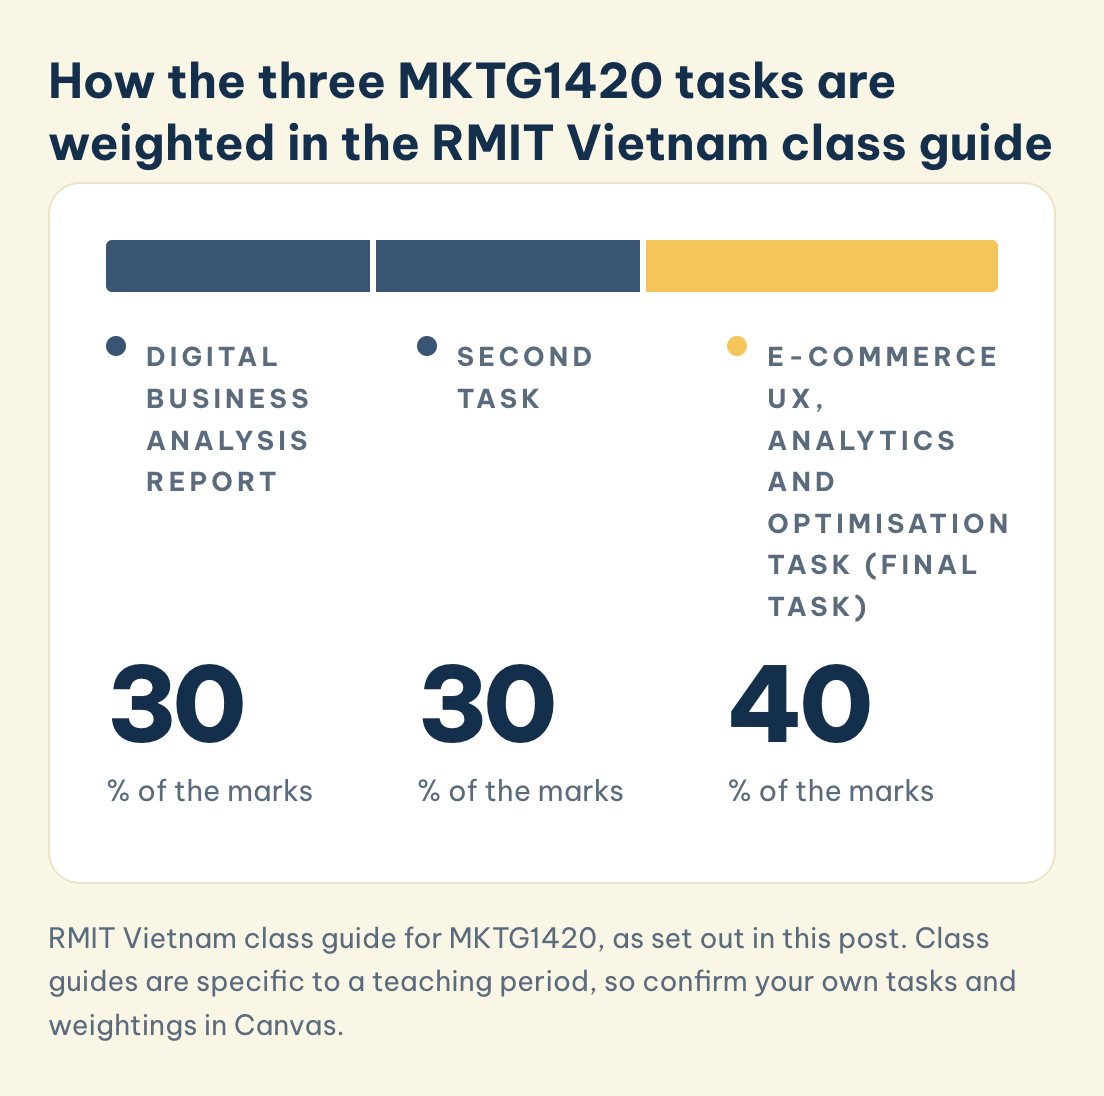
Evidence: RMIT's class guide for this course in Vietnam lists Assessment 1 as a Digital Business Analysis Report at 30%, Assessment 2 at 30%, and Assessment 3 as E-commerce UX, Analytics and Optimisation at 40%, and describes learning activities including analysing real case studies, applying SEO, Search AI and PPC tools, designing and monitoring an ecommerce website with attention to user experience and customer journey, and using analytics to assess effectiveness and justify strategic decisions.
Example: A student split his time evenly across the three tasks and produced a rushed final submission. His mentor did the arithmetic with him: the last task was worth more than either of the others and carried the outcomes the whole course builds towards. The lesson was scheduling, not writing.
◆ Question 3 / 7 · Optimisation recommendations
Why do most optimisation recommendations lose marks?
Direct answer: Because they are opinions wearing the clothes of analysis. "Improve the user experience" and "make the site more engaging" name no problem, no mechanism and no measure. A recommendation earns marks when it has four parts: the observed problem with its evidence, the hypothesis about why it happens, the specific change, and the metric that would show whether the change worked. If you cannot state what result would prove you wrong, you have not made an analytical claim.
Evidence: Kohavi et al. (2020) document how routinely intuitions about interface changes fail when tested, which is why controlled experimentation exists at all. The implication for your assignment is direct: a recommendation presented as self-evidently good ignores the single best-established finding in the field, that most proposed improvements do not improve anything.
Example: A student recommended redesigning a checkout page because it "looked outdated". Her mentor asked what the analytics showed. Drop-off was concentrated at the shipping-cost step, not the visual design. The revised recommendation targeted cost transparency earlier in the journey, with cart abandonment rate as the measure. Same page, an evidenced argument instead of a taste judgement.
◆ Question 4 / 7 · Writing about SEO
How do you write about SEO without the work dating instantly?
Direct answer: Write about mechanisms and constraints, not about current tactics. Ranking behaviour, interface features and even the meaning of a click change between drafting and marking, especially as AI-generated answers absorb queries that once produced visits. What holds is the underlying logic: search engines must crawl, index and rank; indexing requires accessibility; ranking requires relevance signals and evidence of trust; and any measurement that counts visits will understate value when answers are delivered without a click. Frame claims so an update cannot falsify them, and treat the shift towards AI answers as a measurement problem you name explicitly rather than a trend you gesture at.
Evidence: RMIT's course description lists the durable elements, keyword research, optimised content, getting pages indexed, link building and tracking outcomes, while the class guide adds Search AI tools to the toolset. The stable objects are the pipeline stages; the tactics attached to each stage are what change.
Example: A student built a section on a specific ranking factor she had read about on a marketing blog, with no primary source. Her mentor asked her to rewrite one level up: what problem is a search engine solving when it weights that signal? The revised section survived scrutiny because it explained a mechanism instead of repeating a rumour.
◆ Question 5 / 7 · Which theory
Which theory belongs in a technical marketing assignment?
Direct answer: Students often assume a technical course does not need theory, then lose marks in the critical analysis criterion. Use theory to explain why a technical intervention should work on human behaviour.
| What you are analysing | Framework that fits | The argument it enables |
|---|---|---|
| Why users abandon a site or feature | Technology acceptance, perceived usefulness and ease of use (Davis, 1989) | Whether the barrier is utility or effort, which points to different fixes |
| Whether your ecommerce site is actually good | E-S-QUAL electronic service quality dimensions (Parasuraman et al., 2005) | Efficiency, fulfilment, system availability and privacy as assessable dimensions rather than "look and feel" |
| Where in the journey the problem sits | Customer experience across the journey (Lemon & Verhoef, 2016) | That experience is cumulative across touchpoints, so a fix at one point may move a problem rather than solve it |
| Whether the e-CRM approach is coherent | Strategic CRM framework (Payne & Frow, 2005) | CRM as a cross-functional strategy rather than a piece of software |
| Whether a proposed change should be believed | Controlled experimentation (Kohavi et al., 2020) | That the claim needs a test, and that small samples cannot settle it |
| Whether an interface problem is real | Usability heuristics (Nielsen, 1994) | A structured vocabulary for describing what is wrong, instead of "confusing" |
Evidence: Davis (1989) built the case for measuring these reactions instead of assuming them: the paper's own scales exist to test "perceived usefulness and perceived ease of use, which are hypothesized to be fundamental determinants of user acceptance" (Davis, 1989, p. 319), which is why the table above treats utility and effort as separate, testable diagnoses rather than one vague complaint about a site. Parasuraman et al. (2005) developed E-S-QUAL specifically because general service-quality measures did not fit online contexts, giving you defined dimensions to assess. Lemon and Verhoef (2016) synthesised the customer journey literature and stressed that experience forms across touchpoints over time, which is why isolated page-level fixes often disappoint.
Example: A student described a site as "hard to use" throughout his report. His mentor introduced usability heuristics. The same observations became specific violations, poor visibility of system status at checkout, no clear exit from a modal, and each mapped to a concrete fix. The vocabulary alone lifted the analysis.
◆ Question 6 / 7 · Small data
How do you handle analytics honestly when your data is small?
Direct answer: State what your data can and cannot support, and let that limit shape your conclusions rather than hiding it. Student ecommerce projects typically run on low traffic, which means a difference between two versions can easily be noise. Do not report a percentage change from a handful of sessions as if it settled the question.
Instead, describe the direction of the evidence, state the sample, name the confounds, and say what a properly powered test would require. Markers reward that honesty because it demonstrates you understand the method rather than performing it.
Evidence: Kohavi et al. (2020) emphasise that adequate sample size and trustworthy instrumentation are preconditions for drawing conclusions from online experiments, and warn against surprising results being accepted uncritically. A student who names their own power limitation is applying that standard rather than ignoring it.
Example: A student reported that a headline change "increased conversions by 40%". The underlying figures were seven conversions against five. Her mentor did not tell her to delete the finding, but to report it accurately with the raw counts and to state what sample would be needed to trust it. That paragraph became evidence of analytical maturity.
◆ Question 7 / 7 · Task structure
What structure works for the analysis and optimisation tasks?
Direct answer: For the analysis report: state the business model and how it makes money, analyse the digital capability that model depends on, identify the gap with evidence, then set priorities. For the UX, analytics and optimisation task: baseline first, always. Describe the current state with numbers, locate the problem in the customer journey, propose changes tied to that specific problem, define the measurement plan, and acknowledge limitations. What gets cut in both is the company history, the tool tutorial and any screenshot that appears without interpretation. A screenshot is evidence only when your text says what to look at and why it matters.
Evidence: RMIT assessment is criterion-referenced, meaning work is measured against published rubric criteria rather than ranked against classmates. Describing how a tool works cannot lift a mark; using its output to justify a decision can.
Example: A student's optimisation task contained fourteen screenshots and roughly four sentences of interpretation. His mentor cut it to five screenshots, each followed by an explicit reading of what the data showed and what followed from it. The submission was shorter and scored substantially higher.
Frequently asked questions
Is MKTG1420 the same course as MKTG1428?
Yes, they are the same course record in the RMIT Handbook with different delivery codes by campus. MKTG1420 is RMIT Vietnam Saigon South and MKTG1428 is RMIT Vietnam Hanoi. Class guides are specific to a campus and teaching period, so use your own.
Do I need coding skills for this course?
No. The course focuses on managing and optimising digital business rather than building it from scratch. You will use platform tools, analytics interfaces and search tools, and the marks come from interpretation and justification rather than technical implementation.
Can I use a real business, including a family business, as my case?
Often yes, and a real business usually gives you better evidence. Check your brief first. If you use a family or employer business, disclose the relationship, keep confidential commercial figures out unless you have permission, and be careful that familiarity does not soften your analysis.
Do I need paid tools to do well?
No. Free tiers of analytics and search tools, publicly visible site behaviour and your own structured observation are sufficient. Be explicit about which tool produced which figure, and about the limits of free-tier data.
How many references does the report need?
Your course guide is the authority. As a working guide, expect roughly eight to fifteen quality sources, with peer-reviewed work supporting your framework choices and primary or tool-generated data supporting your case analysis. Marketing blogs may appear as industry context, never as the evidential foundation.
How MAAS mentors support MKTG1420 students
MAAS works as an academic advisor, not a writing service. For MKTG1420 that usually means helping you decode your own brief and rubric, checking that your chosen case will produce usable data before you commit, pressure-testing whether each recommendation names a problem, a change and a measure, and giving feedback where a tool walkthrough should become interpretation. You do the analysis and write the report; the mentor helps you see it the way a marker will.
If you are studying related digital courses, our guides to MKTG1507 Digital Marketing and COMM2955 Social Media Communication cover neighbouring rubrics. You can also read how our academic support service works before you get in touch.
References
Davis, F. D. (1989). Perceived usefulness, perceived ease of use, and user acceptance of information technology. MIS Quarterly, 13(3), 319–340. https://doi.org/10.2307/249008
Kohavi, R., Tang, D., & Xu, Y. (2020). Trustworthy online controlled experiments: A practical guide to A/B testing. Cambridge University Press.
Lemon, K. N., & Verhoef, P. C. (2016). Understanding customer experience throughout the customer journey. Journal of Marketing, 80(6), 69–96. https://doi.org/10.1509/jm.15.0420
Nielsen, J. (1994). Enhancing the explanatory power of usability heuristics. In Proceedings of the SIGCHI Conference on Human Factors in Computing Systems (pp. 152–158). ACM. https://doi.org/10.1145/191666.191729
Parasuraman, A., Zeithaml, V. A., & Malhotra, A. (2005). E-S-QUAL: A multiple-item scale for assessing electronic service quality. Journal of Service Research, 7(3), 213–233. https://doi.org/10.1177/1094670504271156
Payne, A., & Frow, P. (2005). A strategic framework for customer relationship management. Journal of Marketing, 69(4), 167–176. https://doi.org/10.1509/jmkg.2005.69.4.167
Tools & resources
- RMIT Handbook record for Digital Business Development (course 052668), for course learning outcomes and the delivery code attached to each campus.
- Your Canvas class guide, the only authoritative source for your assessment tasks, weightings and due dates, since class guides are specific to a teaching period.
- Free-tier web analytics and search console tools, for the baseline figures your optimisation task depends on.
- Your own dated baseline: record the metrics before you change anything, because you cannot demonstrate improvement without a before.
A free 20-minute consultation is a conversation about where you are with MKTG1420.
Book a free consultation ▸