
◆ Research Methods
How do you read a t-distribution table and find critical values?
A t-distribution table lists the critical t values that mark where a t test becomes significant, arranged by degrees of freedom in the rows and by tail probability in the columns. National Institute of Standards and Technology (n.d.-a) says the same table serves one-sided and two-sided tests, so reading it correctly depends on choosing the right column.
◆ Question 1 / 8 · What a t table shows
What does a t-distribution table show?
Direct answer: A t table gives the critical value of t for a chosen degrees of freedom and significance level. If your calculated t is larger in absolute size than the table value, you reject the null hypothesis. Illowsky and Dean (2023) describe it as a table of t-scores given the degrees of freedom and the right-tailed probability.
The distribution behind the table has a history worth knowing. Student (1908) wrote that "no one has yet told us very clearly where the limit between 'large' and 'small' samples is to be drawn" (Student, 1908, p. 2), and set out to supply tables for samples that were too small for the normal curve. Illowsky and Dean (2023) note that the name comes from the fact that Gosset wrote under the pen name "Student". The tables in use today trace back to that 1908 work: each row is a degrees-of-freedom value, each column is a tail probability, and each cell is the cut-off that a t statistic must pass.
Illowsky and Dean (2023) give a warning that shapes how you should use it, in their words, "The table is very limited. Calculators and computers can easily calculate any Student's t-probabilities" (Illowsky & Dean, 2023, p. 417). The table is a quick lookup for a handful of common significance levels, not a full record of the distribution. For an exact p-value you need software, which the later sections cover. The same reading skill applies to the standard normal table, which is covered in how to read a z table.
◆ Question 2 / 8 · Reading the table
How do you read a t table step by step?
Direct answer: Work out your degrees of freedom, pick your significance level and tail type, then find the row and column that meet. For df = 10 at a two-tailed 5% level, the cell reads 2.228. National Institute of Standards and Technology (n.d.-a) lists the same value under the 0.975 column.
Take a one-sample t test on 11 scores. The degrees of freedom are n - 1 = 10. You want a two-tailed test at the 5% level. Go down to the row for df = 10 and across to the column headed 0.05 for two tails, and the cell shows 2.228. In the National Institute of Standards and Technology (n.d.-a) layout, the headings are cumulative probabilities, so the same cell sits in the 0.975 column, because a two-sided test at α = 0.05 uses 1 - 0.05/2 = 0.975. Different tables label the same numbers differently, and Illowsky and Dean (2023) warn that some tables show the confidence level in the column headings while others show only the area in one or both tails.
Now compare. If your calculated t is 2.50, then |2.50| > 2.228 and you reject the null hypothesis. If it is 1.90, you do not. Oja (2021) states the rule plainly: if the absolute value of your calculated t-score is bigger than the critical t-score, you reject the null hypothesis. The table below shows a few rows for a two-tailed test at α = .05.
| Degrees of freedom | Critical t (two-tailed, α = .05) |
|---|---|
| 10 | 2.228 |
| 20 | 2.086 |
| 29 | 2.045 |
| 30 | 2.042 |
| Infinity | 1.960 |
The values for df = 10, 20, 30 and infinity come from National Institute of Standards and Technology (n.d.-a), and the value for df = 29 comes from the worked example in Turney (2022). 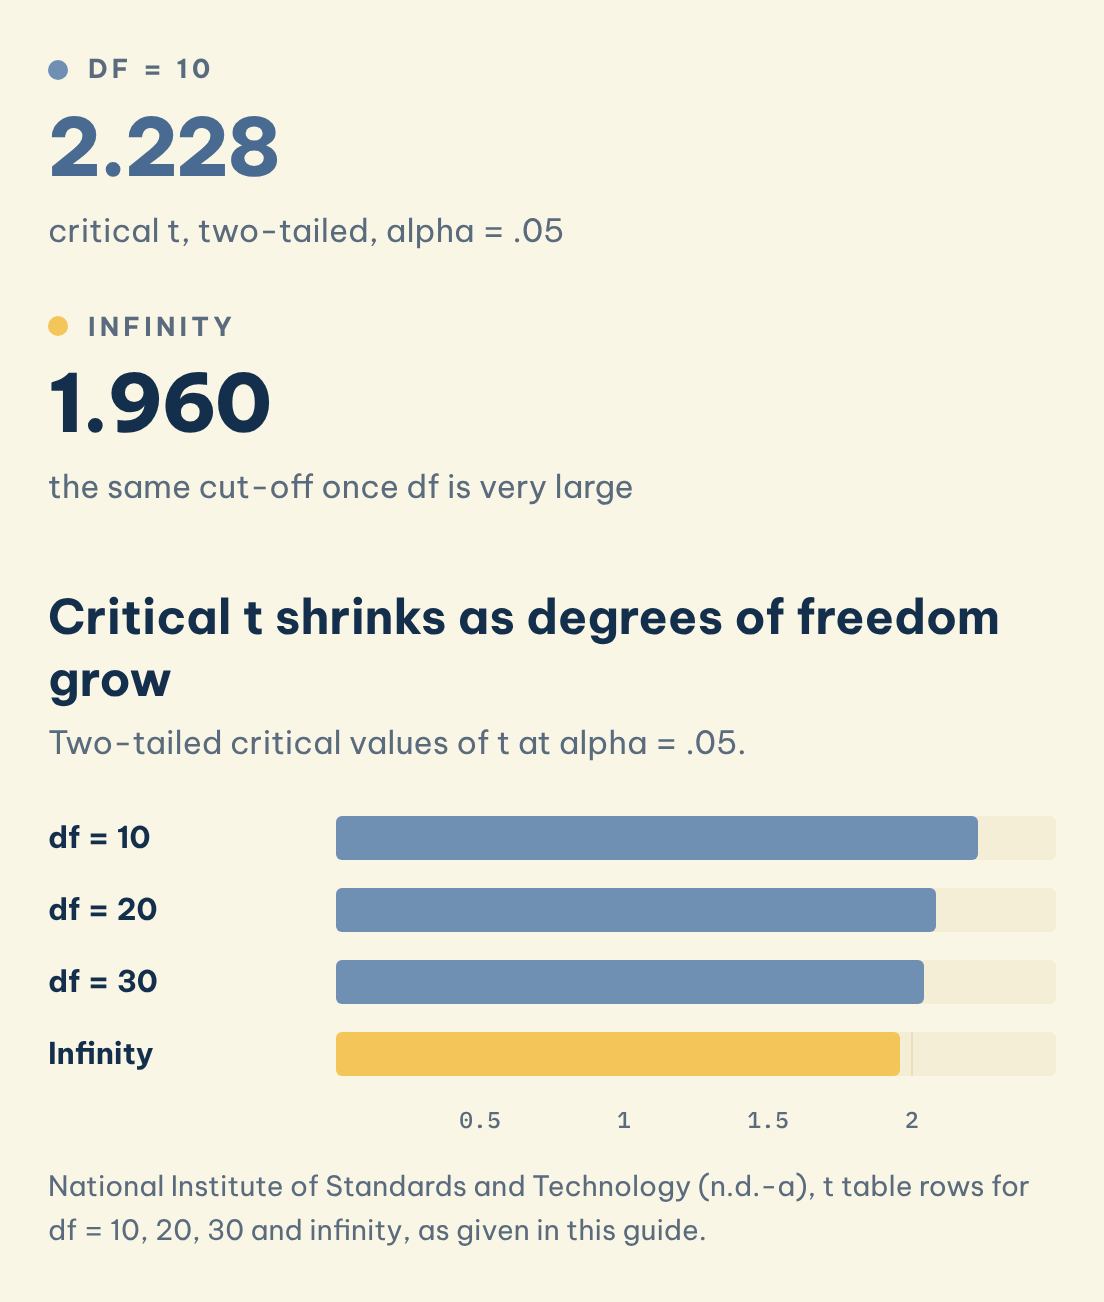
Notice how the numbers shrink toward 1.960 as df grows, which leads to the next point.
◆ Question 3 / 8 · One vs two tails
What is the difference between one-tailed and two-tailed columns?
Direct answer: A two-tailed test splits α across both ends of the distribution, while a one-tailed test puts all of it in one end. Turney (2022) says to use the two-tailed table for two-tailed tests and confidence intervals, and the one-tailed table for one-tailed tests. The same df gives a smaller critical value for one tail.
National Institute of Standards and Technology (n.d.-a) labels its columns with cumulative probabilities, and a two-sided test at α = 0.05 uses the 0.975 column because 1 - 0.05/2 = 0.975. An upper one-sided test at α = 0.025 also uses 1 - α = 0.975, so one column carries two labels: two-tailed 0.05 and one-tailed 0.025 point to the same cell, which reads 2.228 at df = 10. For the same α, though, the two tests do not share a critical value. A one-tailed test at α = 0.05 uses the 0.95 column, where df = 10 gives 1.812, noticeably lower than 2.228, because all 5% of the area is placed in one end.
National Institute of Standards and Technology (n.d.-a) gives the practical rule for the upper tail: find the column corresponding to 1 - α and reject the null hypothesis if the test statistic is greater than the table value. For a lower one-sided test you use the negative of the same value. Decide your tail type from your hypothesis before you look at any data, because switching from two-tailed to one-tailed after seeing a borderline result is not a legitimate way to reach significance.
◆ Question 4 / 8 · Degrees of freedom
How do you find the degrees of freedom to use?
Direct answer: The formula depends on the test. A one-sample or paired t test uses n - 1, an independent-samples test uses n1 + n2 - 2, and regression or correlation uses n - 2. Turney (2022) tabulates these, and Oja (2021) gives the same one-sample, independent and dependent formulas.
The reason for n - 1 is built into how the standard deviation is computed. Illowsky and Dean (2023) explain that the degrees of freedom, n - 1, come from the calculation of the sample standard deviation s (p. 417). For two independent groups you estimate two means, so you lose two degrees of freedom, which gives n1 + n2 - 2. Turney (2022) works an example with 14 and 17 participants: 14 + 17 - 2 = 29, so the two-tailed critical value at α = .05 is 2.045.
| Test | Degrees of freedom |
|---|---|
| One-sample t test | n - 1 |
| Independent-samples t test | n1 + n2 - 2 |
| Dependent (paired) samples t test | n - 1, where n is the number of pairs |
| Regression or correlation | n - 2 |
Oja (2021) stresses that for a paired test, n is the number of pairs, not the number of measurements, which is a common slip. If you want the wider idea behind these formulas, our guide to choosing the right statistical test shows where each t test fits among the other methods. For a plain-language explanation of why the count is reduced at all, see degrees of freedom explained without the jargon.
◆ Question 5 / 8 · df not listed
What if your degrees of freedom is not in the table?
Direct answer: Use the next smaller df listed, which gives a slightly larger and therefore more conservative critical value. Turney (2022) advises rounding down, for example using df = 40 for df = 46. Penn State Eberly College of Science (n.d.) gives the same reason: it is better to err in a conservative manner.
Most printed tables skip values, jumping from 30 to 40 to 60 and so on. If your df is 34, Penn State Eberly College of Science (n.d.) suggests using the closest df that is smaller than the given one. The table entry for df = 30 is 1.697 for a one-tailed 0.05 test, while Minitab returns 1.69092 for df = 34. The table value is slightly larger, so you would never declare significance that the exact calculation would not support. Oja (2021) says rounding down avoids inflating Type I error, meaning false positives, while also reminding students to ask their professor which option the course expects.
For very large samples the problem disappears. The infinity row of the table equals the standard normal values, and National Institute of Standards and Technology (n.d.-a) shows 1.960 there at the 0.975 level. That is why a t table with df = 1 to 100, as many students search for, ends with an infinity row: beyond about 100 degrees of freedom the t values barely differ from the z values.
◆ Question 6 / 8 · Formula or software
Is there a formula, or should you use a calculator?
Direct answer: The table values come from the inverse cumulative distribution of the t distribution, which you rarely compute by hand. Software returns the exact value for any df. Penn State Eberly College of Science (n.d.) says that when software is available, it is best to find the t values rather than use the z.
In practice you type the probability and df into a function instead of working through the density formula. In R the quantile function is qt, so a two-tailed 5% value at df = 10 is qt(0.975, df = 10), which gives 2.228. In Excel, T.INV.2T(0.05, 10) returns the two-tailed value of 2.228 and T.INV.2T(0.10, 10) returns the one-tailed 5% value of 1.812. SPSS and most statistics packages print the exact p-value alongside the t statistic, so you often never need the table at all.
The table still earns its place in three situations. Exams may ban software, a marker may expect you to show the lookup in a method section, and checking a printed table is a quick way to catch a typing error in software output. Illowsky and Dean (2023) describe the table as limited, so use it to confirm a decision rather than to report a p-value to three decimal places. Our guide to thesis statistics help explains what support is appropriate when you are working through the analysis for your own dissertation.
◆ Question 7 / 8 · t table vs F table
How is the t table different from the F table?
Direct answer: The t table has one degrees-of-freedom value and serves both tails because the t distribution is symmetric. The F table needs two, the numerator and denominator degrees of freedom, and covers only the upper tail. National Institute of Standards and Technology (n.d.-b) says the F distribution is asymmetric.
The F table is a separate lookup. National Institute of Standards and Technology (n.d.-b) says a test statistic is computed with ν1 and ν2 degrees of freedom and compared with the table, and for a one-sided test the null hypothesis is rejected when the statistic is greater than the tabled value. It also notes that because the F distribution is asymmetric, a two-sided test requires a set of tables with the rejection regions for both the lower and upper tails.
| Feature | t table | F table |
|---|---|---|
| Degrees of freedom needed | One | Two (ν1 and ν2) |
| Shape of distribution | Symmetric | Asymmetric |
| Tails | One table serves both | Upper tail only in the standard table |
| Typical use | t tests, confidence intervals | ANOVA, comparing variances |
A useful link between the two: a squared t statistic with df degrees of freedom follows an F distribution with 1 and df degrees of freedom, so a two-group comparison gives the same decision whichever table you consult.
◆ Question 8 / 8 · MAAS help
How can MAAS help with t tests and statistical tables?
Direct answer: MAAS works as a tutor and advisor for data analysis. A MAAS expert can walk you through choosing the test, finding degrees of freedom and reading the output in SPSS, R or Python, while you run the analysis and write the interpretation yourself.
If you are stuck between a printed table and software output, SPSS, R and Python help from MAAS follows an Outline, Draft, Final sequence with the guidance of a MAAS expert, who explains why each value is what it is. Bring your data description, your hypothesis and the output you already have, because that lets the expert point to the exact step where the numbers diverge. The first conversation is free.
Frequently asked questions
How do I read a t-distribution table?
Find your degrees of freedom in the rows, choose the column for your significance level and tail type, and read the cell where they meet. National Institute of Standards and Technology (n.d.-a) gives 2.228 for df = 10 at a two-sided 5% level.
Is a one-tailed t table the same as a two-tailed one?
One column can carry two labels, since two-tailed .05 and one-tailed .025 point to the same cell. For the same α the critical value differs, though: at df = 10 it is 2.228 two-tailed and 1.812 one-tailed. National Institute of Standards and Technology (n.d.-a) explains the 1 - α/2 rule behind this.
What do I do when my df is not in the table?
Round down to the next smaller df. Turney (2022) gives the example of using df = 40 when you have df = 46, which keeps the test conservative.
What is the formula for degrees of freedom in a t test?
It is n - 1 for one-sample and paired tests, and n1 + n2 - 2 for independent samples. Oja (2021) lists all three versions.
Why does the last row of the table say infinity?
For very large df the t distribution matches the standard normal distribution. National Institute of Standards and Technology (n.d.-a) shows 1.960 in that row at the 0.975 level.
What is the difference between a t table and an F table?
The F table needs two degrees-of-freedom values and covers the upper tail only. National Institute of Standards and Technology (n.d.-b) explains that the F distribution is asymmetric.
Do I need a table if I have software?
Not for the final p-value. If you would otherwise fall back on z, Penn State Eberly College of Science (n.d.) recommends computing the actual t value instead, and Illowsky and Dean (2023) note that calculators and computers can calculate any t probability.
References
Illowsky, B., & Dean, S. (2023). Introductory statistics (2nd ed.). OpenStax. https://openstax.org/details/books/introductory-statistics-2e
National Institute of Standards and Technology. (n.d.-a). 1.3.6.7.2. Critical values of the Student's t distribution. In NIST/SEMATECH e-handbook of statistical methods. https://www.itl.nist.gov/div898/handbook/eda/section3/eda3672.htm
National Institute of Standards and Technology. (n.d.-b). 1.3.6.7.3. Upper critical values of the F distribution. In NIST/SEMATECH e-handbook of statistical methods. https://www.itl.nist.gov/div898/handbook/eda/section3/eda3673.htm
Oja, M. (2021, March 3). Table of critical t-scores. In PSYC 2200: Elementary statistics for behavioral and social science. LibreTexts. https://stats.libretexts.org/Workbench/PSYC_2200%3A_Elementary_Statistics_for_Behavioral_and_Social_Science_(Oja)_WITHOUT_UNITS/08%3A_One_Sample_t-test/8.03%3A_One-Sample_t-test_Calculations/8.3.01%3A_Table_of_Critical_t-scores
Penn State Eberly College of Science. (n.d.). 5.4.2 - The t-distribution. In STAT 500: Applied statistics. https://online.stat.psu.edu/stat500/book/export/html/521
Student. (1908). The probable error of a mean. Biometrika, 6(1), 1-25. https://doi.org/10.1093/biomet/6.1.1
Turney, S. (2022, April 29). Student's t table (free download) | Guide & examples. Scribbr. https://www.scribbr.com/statistics/students-t-table/
Tools & resources
- Microsoft Support: T.INV.2T function (Excel, two-tailed inverse of the t distribution)
- R documentation: The Student t distribution (qt, pt, dt)
Not sure how this guide applies to your own case? Talk it through with MAAS in a free 20-minute consultation.
Book a free consultation ▸