
◆ Student Success
What does a graded presentation rubric measure?
Category: student-success
Last updated: 2026-09-08
Students preparing a graded presentation rehearse the talking. They practise eye contact, they time the run through, and they redesign the slides. Published rubrics allocate their marks somewhere else. On one widely circulated engineering rubric, technical content carries 60 of the 100 available marks while every criterion resembling delivery carries 10 each, which means the rehearsal effort and the mark allocation point in different directions.
Direct answer: A graded presentation rubric mostly measures the argument, not the performance. Across published rubrics from San Jose State University, AAC&U and University of New Mexico, content, organisation and supporting evidence dominate the scale, delivery occupies a single criterion, and the ability to answer questions appears as its own graded band rather than as a bonus.
Where a figure below comes from 1 institution rather than a general standard, this article says so, because rubrics differ between faculties and the binding document is always the one attached to your own assessment brief.
◆ Section 1 / 8 · How marks are distributed
How are marks actually distributed on a published presentation rubric?
Direct answer: Content outweighs delivery heavily. San Jose State University awards 60 of 100 marks to technical content and 10 each to organisation, presentation skills, verbal communication and overall impression, leaving only 20 of 100 on speaking well. The AAC&U VALUE rubric names 5 criteria, of which delivery is 1, so 80% of that scale sits elsewhere.
How 100 marks are shared on a published engineering presentation rubric
Marks out of 100 on the oral presentation rubric San Jose State University published for engineering coursework.
Technical content
60
marks
Organisation
10
marks
Presentation skills
10
marks
Verbal communication
10
marks
Overall impression
10
marks
Save this figure
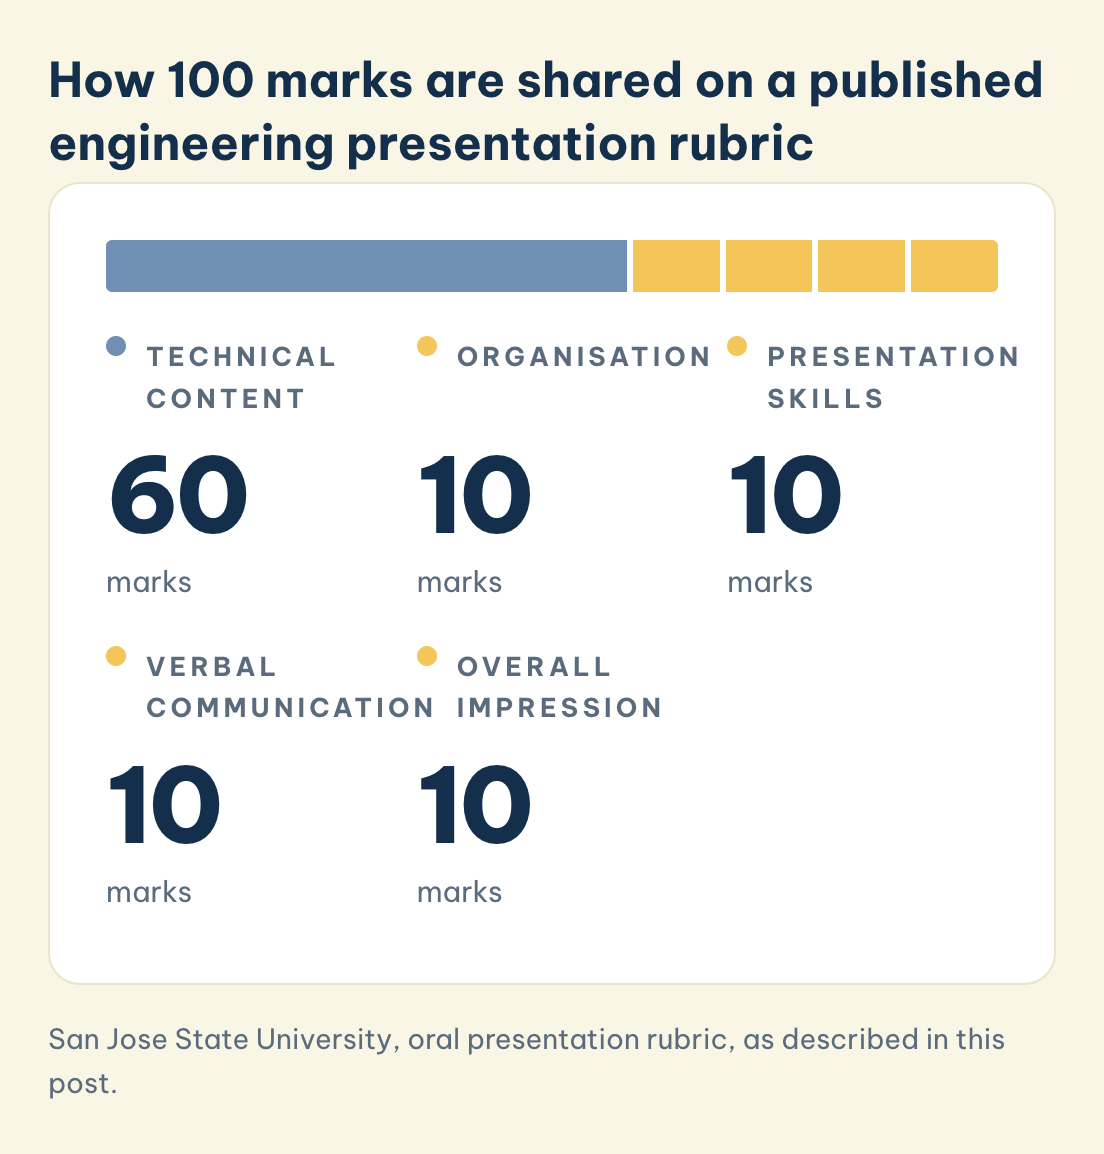
Published rubrics weight content far above delivery. An oral presentation rubric published by San Jose State University for engineering coursework awards 60 of 100 marks to technical content, then 10 each to organisation, presentation skills, verbal communication and overall impression. Only 20 of 100 marks sit on criteria that resemble speaking well.
That distribution reframes preparation time. A student allocating 3 hours to rehearsal and 1 hour to checking whether the argument holds has inverted the weighting the rubric applies. Reading the actual brief before preparing is the cheapest correction available, and it takes under 30 minutes.
AAC&U reaches a similar shape through different criteria. Its VALUE rubric for oral communication names 5 criteria, which are organisation, language, delivery, supporting material and central message. Delivery is 1 of those 5, so even a rubric with equal weighting puts 80% of the scale on things other than how the speaker sounds.
◆ Section 2 / 8 · Below the lowest band
What happens to work that falls below the lowest band?
Direct answer: It scores 0 on that criterion, not a sympathetic minimum. AAC&U instructs markers to assign a zero to any work that does not reach benchmark level, so omitting supporting material altogether loses that criterion outright. Covering all 5 criteria at benchmark level beats excelling at 3 and skipping 2.
AAC&U states the scoring rule for weak work explicitly: "assign a zero to any work sample or collection of work that does not meet benchmark (cell one) level performance." A presentation missing a criterion entirely scores 0 on that criterion rather than a sympathetic minimum, which is a sharper penalty than most students expect.
The practical consequence concerns coverage rather than polish. A student who omits supporting material altogether, however fluently they speak, loses that criterion outright, whereas a student who includes weak supporting material still scores in the benchmark band. Covering all 5 criteria at benchmark level therefore outranks excelling at 3 and skipping 2.
University of New Mexico applies the same logic to question handling in its graduate rubric for civil engineering. Its lowest band for effective communication reads "Unable to answer questions", and its highest reads "Able to respond to questions and facilitate further discussion of results". Question handling is a graded criterion in its own right, not an informal coda after the timer stops.
◆ Section 3 / 8 · Two markers, one score
Do two markers give the same presentation the same score?
Direct answer: Not reliably. Nambiar Veetil et al. (2024) found raters differing by 2 or more points on a 4 point scale for the same performance. Kang (2012) found listener background explained 7% to 9% of variance in ratings, against 18% to 19% explained by prosodic features of the speech itself.
Markers agree less than students assume, and the size of the disagreement has been measured. Nambiar Veetil et al. (2024), writing in JONUS 9(2), 267–296, found raters differing by 2 or more points on a 4 point scale on the same performance, across the criteria of fluency and coherence, lexical resource, grammatical range and accuracy, and pronunciation.
Agreement improves when the rubric is explicit and the markers are trained. Ferrer-Pardo et al. (2022), publishing in Education Sciences 12(11), reported an intraclass correlation of 0.78 between teacher marks and student self assessment across 85 participants in Spain, which is substantial agreement rather than perfect agreement. Salehi and Gholampour (2022), in Mextesol Journal 46(2), reported Cronbach alpha values between 0.70 and 0.95 across 30 presentations assessed over 4 months.
Rater background contributes measurable variance of its own. Kang (2012), in Language Assessment Quarterly 9(3), 249–269, found that listener background variables including native speaker status and tutoring experience explained 7% to 9% of variance in oral performance ratings, while prosodic features of the speech itself explained 18% to 19%. Roughly a third of the explained variance therefore came from who was listening rather than from what was said.
◆ Section 4 / 8 · Why students misjudge
Why do students misjudge what they are being marked on?
Direct answer: Self assessment and peer assessment both drift upward. Warren (2020) found lower performing students overestimating their ability while higher performers underestimated theirs. Wijayanti et al. (2025), surveying 222 students, found peers scoring slide design roughly 10 points more generously than lecturers on every dimension.
Students misjudge presentation assessment in a documented direction, and the gap runs both ways. Warren (2020), in a North Carolina State University thesis, applied the Dunning and Kruger framework to presentation confidence among professional science master's students and found lower performing students overestimating their own ability while higher performing students underestimated theirs.
Peer judgement drifts in the same optimistic direction. Wijayanti et al. (2025), surveying 222 students in Journal of Research in Instructional 5(1), 185–198, found peers scoring slide design higher than lecturers on every dimension. Lecturers scored font size lowest at 76.1 out of 100, whereas the lowest score peers gave any dimension was 85.5 out of 100 for visuals, so peer feedback ran roughly 10 points more generous throughout.
That same study catalogued the weaknesses observers actually recorded: "poorly structured presentation slides, presenters' insufficient attention to the audience, presentation content lacking supporting data and facts, and presenters resorting to verbatim reading." Two of those 4 weaknesses concern evidence and structure rather than delivery, which matches where the published rubrics put their marks.
Ferrer-Pardo et al. (2022) add a finding that complicates rubric distribution as a fix. Correlations between student attainment and perceived rubric usefulness ran between -0.24 and -0.28, meaning stronger students found the rubric less useful than weaker students did. Handing out a rubric helps the students furthest from the standard more than it helps those already close to it.
◆ Section 5 / 8 · Group work
How does group work change the marking?
Direct answer: It adds a second problem, attributing a shared performance to individuals. Maastricht University splits a group mark from a peer assessed individual mark, weighted 15% peer against 35% tutor in first year and inverting to 35% peer by the final year. Tomar and Ventresca (2025) found 69% of 37 groups reporting even contribution once the marking policy rewarded it.
Group presentations introduce a second problem, which is attributing a shared performance to individuals. AAC&U addresses it in its scoring guidance: "For panel presentations or group presentations, it is recommended that each speaker be evaluated separately."
Maastricht University publishes a working model in its EDLAB guidance on assessing individual contribution. Students receive a shared group mark for the report and final presentation plus a separate individual mark for contribution assessed by peers. In first year bachelor programmes the peer assessed component carries 15% against 35% from the tutor, and by the final year the weighting inverts to 35% peer and 15% tutor as groups work more independently.
The reason for splitting the mark is stated plainly in that guidance: "Awarding [a] single shared grade can encourage free-riding (or social loafing). If individual students know that their grade will be dependent upon the effort and achievement of others, there is little incentive to contribute." Tomar and Ventresca (2025) put it bluntly: "free-riding, uneven effort distribution and misreporting remain endemic in group assignments, undermining fairness in grading and learning outcomes."
Interventions have been trialled and measured. Maiden and Perry (2011), in Assessment & Evaluation in Higher Education 36(4), 451–464, tested 6 methods of controlling free riding at a United Kingdom business school. Tomar and Ventresca (2025) reported to ASEE that across 185 engineering students in 37 groups over 1 semester, 69% of groups reported even contribution once the marking policy was designed so that contributing evenly was each individual's best option. Dix (2024), in Asia Pacific Journal of Marketing and Logistics, proposed a 2 point peer survey adjusting individual marks below the group mark for below average contributors.
◆ Section 6 / 8 · Second-language presenters
What changes for students presenting in a second language?
Direct answer: Marking itself shifts. Baitman and Véliz-Campos (2013) found native speaker teachers weighting fluency and pronunciation more heavily than non native teachers, who weighted grammatical accuracy. Vu Tran Le Hoai (2021) recorded over 80% of 53 Vietnamese students reporting anxiety, and Bastian et al. (2026) reframed slide reading as a coping strategy.
Second language presenters face assessment effects that are not about their argument, and some have been quantified. Baitman and Véliz-Campos (2013), in Literatura y lingüística, compared native and non native English speaking teachers marking the same speech samples with a TOEFL iBT rubric and found native speaker teachers weighting fluency and pronunciation more heavily while non native speaker teachers weighted grammatical accuracy and vocabulary.
Vietnamese evidence exists and is worth citing directly rather than inferring from elsewhere. Vu Tran Le Hoai (2021), studying 53 students and 5 lecturers at Văn Lang University, recorded that over 80% of students reported anxiety around presenting, and observed that "some students gave oral presentations on behalf of the whole group... some shy students do not give an oral presentation", which is the free rider problem appearing from the opposite side.
Nguyễn (2026), surveying 153 English major students in Multidisciplinary Reviews 9(8), found students rating individual nonverbal skills between 3.17 and 3.44 on a 5 point scale while rating their overall presenting ability at only 2.87. Students rate each component higher than the whole, which suggests the difficulty sits in integration under live pressure rather than in any single skill.
Bastian et al. (2026), studying 16 undergraduates in Journal of English Language and Education, reframed slide reading as a coping strategy rather than a skill deficit. Reading from slides reduced anxiety and preserved fluency under real time pressure, which means telling a second language student to stop reading without replacing the support removes the scaffold and leaves the anxiety.
◆ Section 7 / 8 · What to do differently
What should a student do differently before the next presentation?
Direct answer: Read the assessment brief before preparing anything. Count how many marks sit on content against delivery, check whether question handling is its own criterion, then build the argument before the slides. Spending 20 minutes anticipating 5 likely questions is worth more than a fourth run through of the script.
Reading the actual rubric first changes the preparation order, and it is the step most often skipped. Locate the assessment brief, count how many marks sit on content against delivery, and check whether question handling appears as its own criterion, because University of New Mexico grades it separately and many faculties follow the same pattern.
Building the argument before the slides follows from the weighting. De Grez et al. (2012), in Active Learning in Higher Education 13(2), 129–142, studied the development of oral presentation competence and found structured criteria and feedback central to improvement, which is consistent with the finding from Limgomolvilas and Sukserm (2025) in LEARN Journal 18(1), 110–134 that rubric design itself shapes measured performance.
Rehearsing the question period deserves at least as much time as rehearsing the talk. Since University of New Mexico places facilitating further discussion at the top band and inability to answer at the bottom, and since AAC&U scores an absent criterion at 0, 20 minutes spent anticipating 5 likely questions is better invested than a fourth run through of the script.
◆ Section 8 / 8 · How MAAS works
How MAAS works on a graded presentation with you
Direct answer: MAAS EdTech begins with the rubric that marks you, not a slide template. A discipline matched expert reads the brief and learning outcomes, works out how marks split between argument and delivery, then reworks the structure until every slide carries one claim. Rehearsal covers the talk and the question period. You still write, prepare and deliver the presentation yourself.
MAAS EdTech starts from the rubric that will mark your work, not from the slide template. A discipline matched expert reads the brief and the module learning outcomes with you, identifies how many of the available marks sit on argument and evidence against delivery, then works through the structure so each slide carries 1 claim with the evidence behind it. Rehearsal covers the question period as well as the talk, since question handling is a graded criterion at many faculties. You prepare and deliver your own presentation, and the expert sets direction and challenges weak reasoning.
Frequently asked questions
How much of a presentation mark is about speaking well?
Less than most students assume. On the San Jose State University engineering rubric, technical content carries 60 of 100 marks while delivery style criteria carry 10 each. On the AAC&U VALUE rubric, delivery is 1 of 5 criteria. Check your own brief, since weightings differ by faculty.
Does answering questions carry marks?
At University of New Mexico it does, as a graded criterion running from "Unable to answer questions" at the lowest band to "Able to respond to questions and facilitate further discussion of results" at the highest. Treat the question period as assessed rather than as an informal extra.
Will two lecturers give my presentation the same mark?
Not exactly. Nambiar Veetil et al. (2024) found raters differing by 2 or more points on a 4 point scale for the same performance. Ferrer-Pardo et al. (2022) reported an intraclass correlation of 0.78 between teacher and self assessment, which is substantial rather than perfect agreement.
Is it true that reading from slides is always bad?
It costs marks under rubrics that assess delivery, and Wijayanti et al. (2025) list verbatim reading among the commonest observed weaknesses. Bastian et al. (2026) found second language students using slide reading to manage anxiety, so the useful response is replacing the scaffold with cue notes rather than removing it.
How are marks split in a group presentation?
Practice varies. AAC&U recommends evaluating each speaker separately. Maastricht University combines a shared group mark with a peer assessed individual component weighted 15% in first year and 35% in the final year, on the stated grounds that a single shared grade encourages free riding.
Does any of this evidence come from Vietnam?
Some does. Vu Tran Le Hoai (2021) studied 53 students at Văn Lang University and Nguyễn (2026) surveyed 153 English major students. Both are small single institution studies, and no publicly available Vietnamese university rubric with stated percentage weightings was located for this article, so the specific weightings quoted here are international.
Related guides
- What goes on each slide of a thesis defence deck?: the same argument first principle applied to a doctoral or master's defence
References
Baitman, B., & Véliz-Campos, M. (2013). A comparison of oral evaluation ratings by native English speaker teachers and non-native English speaker teachers. Literatura y lingüística, 18(1). https://doi.org/10.4067/S0716-58112013000100010
Bastian, A. A., Bungsudi, & Yunianti, E. P. (2026). Bridging the gap between reading and presenting: Examining psychological constraints and adaptive coping strategies in EFL academic presentations. Journal of English Language and Education, 11(3). https://doi.org/10.31004/jele.v11i3.2436
De Grez, L., Valcke, M., & Roozen, I. (2012). How effective are self- and peer assessment of oral presentation skills compared with teachers' assessments? Active Learning in Higher Education, 13(2), 129–142. https://doi.org/10.1177/1469787412441284
Dix, S. (2024). A streamlined survey instrument to moderate university students' grades for group projects. Asia Pacific Journal of Marketing and Logistics. https://doi.org/10.1108/apjml-09-2023-0858
Ferrer-Pardo, V. R., Jiménez-Pérez, I., Gil-Calvo, M., Pérez-Soriano, P., & Priego-Quesada, J. I. (2022). Analysis of the use of rubrics in the self-assessment of oral presentations. Education Sciences, 12(11), 765. https://doi.org/10.3390/educsci12110765
Kang, O. (2012). Impact of rater characteristics and prosodic features of speaker accentedness on ratings of international teaching assistants' oral performance. Language Assessment Quarterly, 9(3), 249–269. https://doi.org/10.1080/15434303.2011.642631
Limgomolvilas, S., & Sukserm, P. (2025). Rubric design and the assessment of oral presentation performance. LEARN Journal, 18(1), 110–134. https://doi.org/10.70730/jqgy9980
Maiden, B., & Perry, B. (2011). Dealing with free-riders in assessed group work: Results from a study at a UK university. Assessment & Evaluation in Higher Education, 36(4), 451–464. https://doi.org/10.1080/02602930903429302
Nambiar Veetil, M., Iqbal, M., & Abugohar, M. A. (2024). Navigating the perception and practice of oral assessment. JONUS, 9(2), 267–296. https://doi.org/10.24200/jonus.vol9iss2pp267-296
Nguyễn, T. T. (2026). Vietnamese English major students' self-perceived nonverbal communication skills in presentations. Multidisciplinary Reviews, 9(8), 2026371. https://doi.org/10.31893/multirev.2026371
Salehi, M., & Gholampour, S. (2022). Rating scale validation in assessing oral presentations. Mextesol Journal, 46(2). https://doi.org/10.61871/mj.v46n2-11
Tomar, M., & Ventresca, M. (2025). Game theoretic course policy design for fair grading in team-based collaborative assignments. ASEE Annual Conference & Exposition. https://peer.asee.org/game-theoretic-course-policy-design-for-fair-grading-in-team-based-collaborative-assignments.pdf
Vu Tran Le Hoai. (2021). Using group oral presentations as a formative assessment in teaching English for Vietnamese EFL students. Advances in Social Science, Education and Humanities Research. https://doi.org/10.2991/assehr.k.210226.036
Warren, S. E. (2020). Professional science master's students' confidence and competence with presentation skills [Master's thesis, North Carolina State University]. https://lib.ncsu.edu/resolver/1840.20/37270
Wijayanti, S. H., Widyastuti, T. D., Ristyantoro, R., & Pramono, H. (2025). An investigation of the quality of presentation slide design and oral communication in higher education. Journal of Research in Instructional, 5(1), 185–198. https://doi.org/10.30862/jri.v5i1.608
Tools & resources
- San Jose State University. Oral presentation rubric. https://www.sjsu.edu/people/nikos.mourtos/docs/Oral%20Presentation%20Rubric.pdf
- Association of American Colleges and Universities. Oral communication VALUE rubric. https://www.aacu.org/initiatives/value-initiative/value-rubrics/value-rubrics-oral-communication
- Maastricht University EDLAB. Assessing the individual contribution in groupwork. https://cris.maastrichtuniversity.nl/en/publications/015913c3-794d-4c77-bbf9-c256d8bce212
A free 20-minute consultation is a conversation about your situation, with your assessment brief and rubric in hand. It is not a review of your slides or your script.
Book a free consultation ▸