
Most courses add your marks and tell you whether the total clears fifty. At least one published ECON1310 offering does not. A UQ profile for Summer Semester 2025 states a student must score at least 45% on the final exam to pass, and falling below caps the result at a marginal fail regardless of semester work. A student can bank strong tutorial marks all term, sit a bad exam, and fail a course their total says they passed.
Author: MAAS Editorial Team
Last updated: 2026-08-11
Category: economics

Read your own course profile, because this one moves
Direct answer: ECON1310 Introductory Statistics for Social Sciences is a 2-unit course in the University of Queensland School of Economics, and its assessment structure has differed between offerings. One profile weighted six quizzes at 25 per cent combined and three problem sets at 25 per cent each, while another weighted in-tutorial work at 40 per cent against a 60 per cent exam.
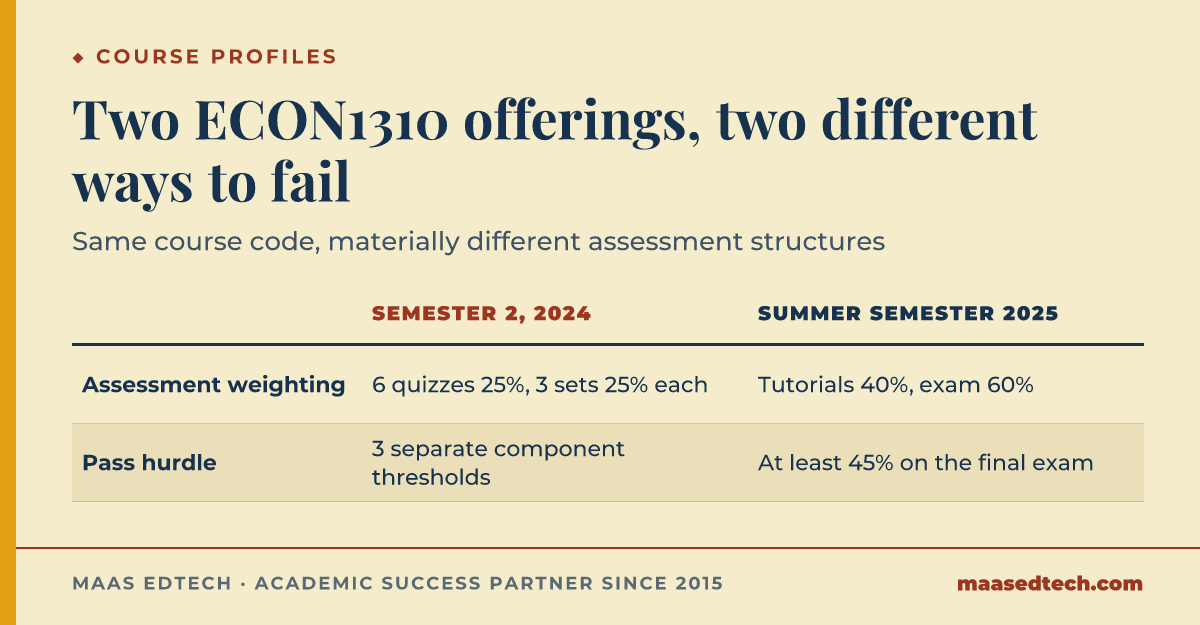
Two published profiles make the point better than any warning could.
| Offering | Assessment as published | Hurdle as published |
|---|---|---|
| Semester 2, 2024 | Six quizzes aggregating to 25 per cent, plus three problem sets at 25 per cent each | Three separate minimum thresholds across components |
| Summer Semester 2025 | In-tutorial assessment 40 per cent, best 8 of 12 submissions, plus a 60 per cent end-of-semester exam | At least 45 per cent on the final exam |
According to the University of Queensland course profiles above, the Semester 2, 2024 offering aggregates six quizzes to 25% and adds three problem sets worth 25% each, with three separate minimum thresholds across those components. The Summer Semester 2025 offering instead weights in-tutorial assessment at 40% across the best 8 of 12 submissions and a single end-of-semester exam at 60%, with the 45% hurdle attached to that exam alone. Reading your own ECON1310 profile in week one, rather than assuming either structure carries over, is the only way to plan correctly, since the School of Economics revises offerings from year to year.
Same course code, same school, materially different structures and materially different ways to fail. Any study plan built from a friend's experience, a shared summary, or an article like this one is built on the wrong year unless you check. Open the profile for your own offering in week one and read the assessment section before the content section.
On prerequisites: the published University of Queensland profiles list Maths B, Maths C, MATH1040, or Mathematical Methods or Specialist Mathematics. There is also a long incompatibility list covering STAT1201, STAT1301, STAT2201 and several engineering and pharmacy courses, so if you have credit in any of those, check before enrolling.
Why does the cumulative structure hurt more here than elsewhere?
Direct answer: Because every topic is built from the previous one, so a week missed does not cost you that week's content. It costs you everything downstream.
The chain is tight. Descriptive statistics feed probability, probability feeds sampling distributions, sampling distributions make confidence intervals intelligible, confidence intervals and hypothesis testing are the same machinery in two forms, and simple linear regression is that machinery applied again. A student who never quite understood sampling distributions can still perform the mechanical steps of a hypothesis test, and will be unable to explain a single result.
Evidence: Cepeda et al. (2006), publishing in Psychological Bulletin, synthesised over a century of research on distributed practice and found that spacing study across sessions produces substantially better retention than massing the same total time together. The authors describe their own review as one that "performed a meta-analysis of the distributed practice effect to illuminate the effects of temporal variables that have been neglected in previous reviews" (Cepeda et al., 2006, p. 354). That finding is general, and it bites hardest in a course whose content compounds, because cramming a cumulative subject means learning week nine while week four is still missing.
Example: A student who fell behind in probability during a heavy assessment fortnight kept up with tutorials by pattern-matching to worked examples. It held until hypothesis testing, where the questions stopped resembling one another. The repair took a weekend and would have taken an hour in week four. Pattern-matching fails the same way in first-year accounting once a case hides which question type it is asking, a trap the MAAS guide to ACCT1101 Accounting for Decision Making sets out in detail.
The practical rule: in a cumulative course, treat a week you did not understand as an emergency rather than a backlog item. Nothing later gets easier while it is unresolved.
What does the exam actually reward?
Direct answer: Choosing the right procedure for an unfamiliar scenario and stating what the output means, rather than executing a procedure you were told to use.
Tutorial questions usually announce the tool. Exam questions describe a situation and leave the choice to you, which is a different skill and one that pattern-matching does not build. The decisions are few enough to list.
- What is being asked? An estimate of a population value points to a confidence interval; a claim to be tested points to a hypothesis test.
- What kind of data? Means and proportions take different machinery, and paired observations are not two independent samples.
- What do you know about the population? Whether the standard deviation is known, and what the sample size is, drives the distribution you use.
- What does the output mean here? Not the definition of a p-value in general, but what this result says about this scenario.
Evidence: The published University of Queensland course description places the main emphasis on inferential statistics, with estimation and hypothesis testing central and regression continuing the same logic. A course organised that way is testing whether you can move between a described situation and the correct inferential tool, which is the step that separates marks.
Example: Given a scenario about average delivery times, a student ran a test comparing two means correctly, having failed to notice that the same vehicles were measured before and after a change. The paired structure required different treatment. The arithmetic was flawless and the answer was wrong from the second line.
How should you use Excel without hiding behind it?
Direct answer: As the calculator, never as the reasoning. Published profiles for this course emphasise Microsoft Excel for analysis and presentation, which makes output easy to generate and easy to misread.
The risk is specific. A Microsoft Excel spreadsheet will happily return a t-statistic for data that violates the assumptions of the test, and it will format the result attractively. Nothing in the output announces that the wrong tool was used. This is why the interpretation sentence carries the marks: it is the only place where your understanding is visible.
Build the habit of writing one sentence under every Microsoft Excel output you generate, naming what it says in the language of the scenario rather than the language of statistics. It costs seconds during practice and it converts directly into exam technique, because that sentence is what the exam is asking for.
If English is not your first language, what is the real obstacle?
Direct answer: Usually the word problems rather than the statistics, and specifically the step of turning a described scenario into a testable claim.
The mathematics is symbolic and language-neutral. The difficulty sits in reading a paragraph about a company, a policy or a survey and extracting what the null hypothesis should be. That is a comprehension task wearing a statistics costume, and practising it is different from practising calculation.
A workable drill: take exam-style scenarios and write only the first two lines for each, namely the hypotheses and the reason for your choice of test. Do not compute anything. Twenty scenarios treated this way build the skill the exam actually gates on, in a fraction of the time it takes to solve twenty problems fully.
There is also a well-documented emotional dimension worth naming. Onwuegbuzie and Wilson (2003), writing in Teaching in Higher Education, reviewed the literature on statistics anxiety and found it widespread among social science students and associated with avoidance and procrastination rather than with lower ability. If you have been putting this course off, that pattern is common, has been studied, and responds to starting small rather than to trying harder.
Keep the technical terms in English and hold them apart. A confidence interval is not a probability statement about the parameter, significance is not importance, and a sample statistic is not a population parameter. These distinctions are the examinable content.
A revision approach that suits this course
Direct answer: Short, frequent, spaced sessions from week one, with a weekly checkpoint on whether last week is still solid.
Because the material compounds, revision that begins in the final fortnight is structurally too late. The alternative is undramatic: three or four short sessions a week from the start, each spending part of its time on older material rather than only on the current topic. Cepeda et al. (2006) found that spacing beats massing even when total time is held constant, which means this costs nothing extra.
If your offering carries a hurdle on the final exam, weight your practice toward exam-format questions earlier than feels natural, since coursework marks cannot rescue an exam that falls below the threshold.
What a MAAS mentor can help with here
Our role is advisory. On this course the useful work is diagnostic, because the visible problem is rarely the actual one. A mentor will find where the chain broke, which is usually several weeks before the ECON1310 topic you are struggling with; work through how you choose a test rather than how you run one; read your interpretation sentences for whether they say something about the scenario; and check that your semester plan accounts for any hurdle in your own University of Queensland profile. You do the practice, you sit the exam, and the work you hand in is yours.
Frequently asked questions
Which institution does this describe?
The University of Queensland, where ECON1310 is Introductory Statistics for Social Sciences, a 2-unit course in the School of Economics. Similar codes exist elsewhere for unrelated courses, so confirm the title on your own enrolment.
Is there really a rule that can fail me despite a passing total?
One published offering states a requirement of at least 45% on the final exam, with a cap at marginal fail below that. Another published offering used a different structure with several component thresholds. Hurdles vary between offerings, which is exactly why you must read the profile for your own semester rather than trusting any secondhand account.
What maths do I need beforehand?
The published profiles list Maths B, Maths C, MATH1040, or Mathematical Methods or Specialist Mathematics. Requirements are reviewed, so verify against your own year.
Can I count a statistics course I already passed?
Possibly not. The published incompatibility list includes STAT1201, STAT1301, STAT2201 and several others. Check before enrolling, because incompatible credit is not granted twice.
Why do people call this course hard?
Mostly because it compounds. The individual topics are standard introductory material at the University of Queensland; the difficulty comes from the fact that falling behind is expensive in a way it is not in a modular course.
Does it lead anywhere?
It is the standard preparation for further quantitative work, including introductory econometrics. Understanding rather than passing is what makes the next course manageable.
Related reading
Ask a MAAS mentor about your course
If you are continuing into applied regression after this course, the same interpretation habits carry straight over into the ECON2300 Introductory Econometrics research report.
References
Cepeda, N. J., Pashler, H., Vul, E., Wixted, J. T., & Rohrer, D. (2006). Distributed practice in verbal recall tasks: A review and quantitative synthesis. Psychological Bulletin, 132(3), 354–380. https://doi.org/10.1037/0033-2909.132.3.354
Onwuegbuzie, A. J., & Wilson, V. A. (2003). Statistics anxiety: Nature, etiology, antecedents, effects, and treatments, a comprehensive review of the literature. Teaching in Higher Education, 8(2), 195–209. https://doi.org/10.1080/1356251032000052447