
Read the published learning outcomes for Quantitative Business Analysis and one word sits where you would not expect it. The unit asks you to apply statistical tools and test business hypotheses, then asks you to communicate quantitative findings in a professional and ethical manner. Ethics is not usually named in a first-year statistics unit. Its presence signals what this unit actually marks, because you cannot be unethical with a calculation, only with a claim.
Author: MAAS Editorial Team
Last updated: 2026-08-11
Category: business-management

What is the unit, and who has to take it?
Direct answer: BUSS1020 Quantitative Business Analysis is a 6-credit-point unit in the Business School at the University of Sydney (USYD), and a junior core unit of the Bachelor of Commerce, which means most commerce students take it in first year rather than choosing it.
Evidence: The published unit page sets it at 6 credit points and opens the description with the reason it exists: all graduates from the BCom need to be able to use quantitative techniques to analyse business problems. The page also lists an unusually long set of prohibitions, including ECMT1010, MATH1005, DATA1001 and several others, which tells you something useful. A unit prohibited against that many statistics offerings is the business faculty's designated version of a skill the whole university teaches, tuned to business problems rather than to mathematics.
One detail worth checking rather than assuming: the current page lists assumed knowledge as none. Students often arrive expecting a mathematics prerequisite and some talk themselves out of the unit before starting. Confirm it on the page for your own year, then stop worrying about the entry bar and start worrying about the interpretation, which is where the difficulty actually lives.
Where is the real difficulty in this unit?
Direct answer: In saying what a result licenses you to conclude, not in producing the result.
Software does the computation. You will run tests in a spreadsheet or in statistical software such as SPSS, and the number will appear whether or not you understand it. What remains for a marker to assess is the sentence you write next, and that sentence is where the unit separates students.
| What you produced | The claim it does not support |
|---|---|
| A significant p-value | That the effect is large, or that it matters to the business |
| A strong correlation | That one variable causes the other |
| A regression coefficient | That the relationship holds outside the range of your data |
| A sample result | That the population behaves this way, if the sample was not drawn properly |
Evidence: The four gaps in that table are not pedantic distinctions invented by markers. Wasserstein and Lazar (2016), writing in the journal American Statistician, set out the American Statistical Association's formal statement on p-values precisely because misinterpretation had become widespread in published research, and among their principles are that a p-value does not measure the size of an effect or the importance of a result, and that scientific conclusions should not be based only on whether a threshold is crossed. Greenland et al. (2016), publishing in the European Journal of Epidemiology, catalogued the specific misreadings in detail. Their statement is direct. A P value assumes the test hypothesis is true, and it "is not a hypothesis probability and may be far from any reasonable probability for the test hypothesis" (Greenland et al., 2016, p. 340). Creswell and Creswell (2018) make a related point about quantitative research more broadly: a sound design states in advance what a result would and would not establish, so interpretation is not improvised after the number appears. When a first-year unit names ethical communication in its outcomes, this is the territory it is pointing at.
Example: A student found a statistically significant relationship between an advertising variable and sales, and concluded that the company should increase advertising spend. The result was significant and the coefficient implied a commercially trivial effect on a large sales base. The stronger version of that answer reported the same test, noted the effect size in dollars, and said that significance here indicates the relationship is unlikely to be noise rather than that it is worth acting on.
How should you write up a statistical result?
Direct answer: Report what you did, what you found, what it means in business terms, and what it does not establish. The fourth part is the one students skip and the one that carries the marks.
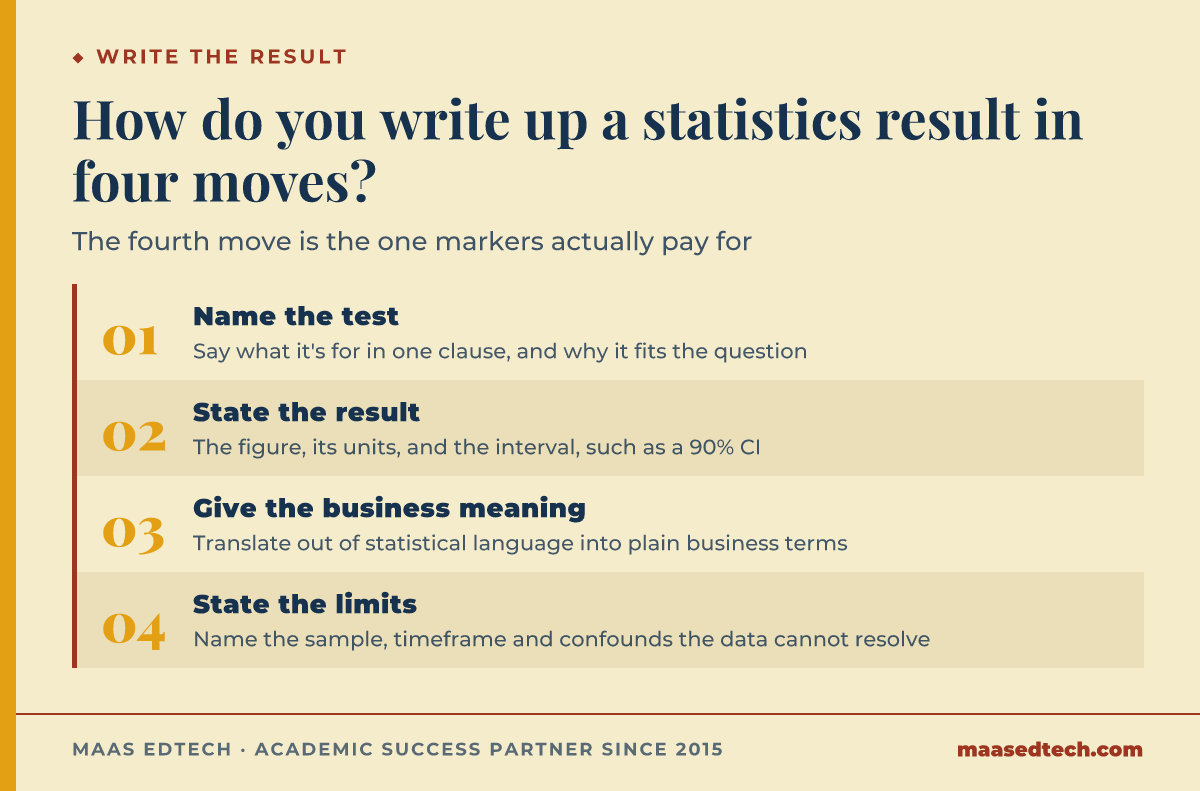
The habit is easier to build than it looks, because it is the same four moves every time.
- The test and why it fits. Name it and say what it is for, in one clause. A t-test, an ANOVA, and an OLS regression each answer a different question. A test chosen without justification reads as a test chosen because it was in last week's lecture.
- The result. The figure, with its units, and the interval where one applies, for instance a coefficient of 0.20 with a 90% confidence interval running from 0.05 to 0.35.
- The business meaning. Translate out of statistical language. Not the coefficient is 0.34 and significant at the 5% level, but each additional dollar of spend is associated with 34 cents of extra revenue, which does not cover its own cost.
- The limits. What the data cannot tell you. Sample, timeframe, confounding, whether the relationship is observational.
Evidence: The unit's own outcome asks you to communicate findings professionally and ethically, and step four is what that phrase means operationally. An analysis presented without its limits is not merely incomplete; it is the specific failure the outcome names. The same care applies to a 95% confidence interval: the percentage describes how often intervals built this way would capture the true population value across repeated samples, not the probability that this specific interval contains it.
Example: Two write-ups of the same regression differed by one sentence. The first ended at the business meaning. The second added that the data covered a single product line over 11 months, so the relationship should not be assumed to hold across the portfolio or across a full seasonal cycle. That sentence cost thirty seconds and demonstrated the outcome the first write-up left unevidenced.
What trips students up most often?
Direct answer: Treating the unit as mathematics, and treating a correct number as a finished answer.
Students who were strong at school mathematics sometimes find this unit oddly frustrating, because the part they are good at is automated and the part being graded is prose. Students who feared mathematics sometimes do better than they expect, for the same reason. Neither group should plan around their history with the subject.
For students writing in English as an additional language, the specific pressure sits in hedging. Statistical writing runs on calibrated language, and the calibration is not decoration: suggests, is associated with, is consistent with, does not establish, within this sample. Writing proves or shows that X causes Y is read as a conceptual error, not a wording slip, because in statistics those words have technical force. The same discipline applies right at the conventional 5% significance threshold, or the stricter 1% threshold some fields prefer: crossing or missing it by a fraction changes the hedge you should use, not the certainty you are allowed to claim. Getting this right is one of the cheapest mark gains available in the unit, since it requires no extra analysis at all.
Keep the technical vocabulary in English and keep it precise. Significance, effect size, confidence and probability each carry a narrow meaning here, and the everyday senses of those words are close enough to the technical ones that loose use is easy and costly.
How do you revise for something you cannot memorise?
Direct answer: By interpreting outputs rather than by re-deriving formulas, the same skill Creswell and Creswell (2018), in a text published by SAGE Publications, place at the centre of a defensible quantitative design.
A practical routine is to find any published regression or survey result, since outputs from the Australian Bureau of Statistics (ABS), the Reserve Bank of Australia (RBA), or the OECD all work well. Look only at the output, and write the four-part paragraph above without looking at the original author's interpretation. Then compare. The gap between your reading and theirs is the actual curriculum, and it surfaces in 10 minutes in a way that re-reading lecture slides never does.
This revision routine works because the exam gives you output and asks for meaning, which is the reverse of the direction most revision runs. Reworking a problem you have already solved rehearses a procedure. Reading an unfamiliar output builds the judgment that gets marked.
How MAAS mentors help on quantitative units
We work as advisors, and on a unit like this the work is almost entirely about your claims rather than your arithmetic. A mentor will ask what a result entitles you to say and press when the answer overreaches, check that your write-up translates statistics into business meaning, look for the limitation you did not state, and test whether your chosen method actually suits the question you asked. The analysis stays yours, the conclusions stay yours, and what you submit is your own.
Frequently asked questions
Which university is this about?
The University of Sydney, where BUSS1020 is Quantitative Business Analysis, a 6-credit-point junior core unit in the Bachelor of Commerce. Codes beginning BUSS are used elsewhere for different subjects, so match the unit title on your enrolment before relying on any material you find.
Do I need strong mathematics?
The current unit page lists assumed knowledge as none. Comfort with numbers helps, but the marks concentrate in interpretation and written explanation rather than in manual calculation, and requirements are reviewed between years, so check the page for your own year.
Why can I not count another statistics unit instead?
The unit page lists prohibitions against a long list of statistics offerings across the university, including ECMT1010, MATH1005 and DATA1001. If you have already passed one of them, or plan to, check the prohibition list before enrolling, because credit will not be granted for both.
Is the exam about formulas?
Less than students expect. The published outcomes centre on applying tools, testing hypotheses and communicating findings, which is a set of skills about choosing and interpreting rather than about recall.
What is the most expensive single mistake?
Claiming causation from observational data. It is the error most likely to be penalised heavily, because it is exactly what the ethical communication outcome exists to test.
When does the unit run?
The unit page lists Semester 1 and Semester 2 offerings, with delivery modes that have varied between years. Confirm the current pattern before planning your enrolment around it.
Related reading
Ask a MAAS mentor about your unit
References
Creswell, J. W., & Creswell, J. D. (2018). Research design: Qualitative, quantitative, and mixed methods approaches (5th ed.). SAGE Publications.
Greenland, S., Senn, S. J., Rothman, K. J., Carlin, J. B., Poole, C., Goodman, S. N., & Altman, D. G. (2016). Statistical tests, P values, confidence intervals, and power: A guide to misinterpretations. European Journal of Epidemiology, 31(4), 337–350. https://doi.org/10.1007/s10654-016-0149-3
Wasserstein, R. L., & Lazar, N. A. (2016). The ASA statement on p-values: Context, process, and purpose. The American Statistician, 70(2), 129–133. https://doi.org/10.1080/00031305.2016.1154108