
◆ Economics
ECON2300: how do you write the econometrics research report?
Students who struggle in ECON2300 rarely struggle with the arithmetic. They struggle because the report asks for a kind of argument no earlier economics course has asked them to make. You are not being asked whether the regression ran. You are being asked whether the number it produced means what you say it means, and that question is settled by your research design rather than by your output.
◆ Question 1 / 6 · The course
What is ECON2300, and what should you have before you start?
Direct answer: ECON2300 Introductory Econometrics is the applied regression course in the University of Queensland economics program. It sits on top of introductory economic statistics, and it moves you from describing data to estimating relationships in data, typically over 13 teaching weeks.
Evidence: The prerequisite chain, credit value and assessment structure are set in the Electronic Course Profile published for your semester, which is the only authoritative source for those details. The gap that catches most students is not a gap in mathematics, it is a gap in what counts as a finding. In a statistics course, a correct calculation is the answer. In econometrics, a correct calculation is the beginning of the answer, because the same coefficient can be a causal effect, a prediction, or a summary of a conditional average, and nothing in the R output tells you which one you have. Goel (2025), in a discussion paper issued by the Institute of Labor Economics that has not yet been through peer review, argues that widely used textbooks conflate 3 distinct population parameters, the population regression function, the conditional expectation function, and the causal effect, and that students are left to intuit from context which one is under discussion. That paper, IZA Discussion Paper 18007 of July 2025, works through the same 6 textbooks that Chen and Pearl (2013) examined. Goel's note, issued as IZA Discussion Paper No. 18007 in July 2025, builds directly on the same 6 textbooks Chen and Pearl examined, among them the Greene, Kennedy, Stock and Watson, and Wooldridge titles, several of which still appear on Australian reading lists. The note was written at Pitzer College and the Institute of Labor Economics in Bonn, and it takes its second foundation from the 2009 book Mostly Harmless Econometrics, so 3 separate strands of the literature now converge on the same complaint about notation. Only the third of those 3 is what an economics rubric usually cares about, and it is the one the output never labels.
Example: A student who came to MAAS in her second year had scored well in every statistics assessment and then lost marks across an entire econometrics report. Her regressions were correct across all 5 models. Her sentence about each coefficient began "this shows that", and in every case what it actually showed was a conditional association she had presented as a cause.
What to do about it: in week 1, write down the 3 things the Electronic Course Profile settles, the weighting of each item, the submission dates, and whether any component carries a hurdle. Reading it properly takes 20 minutes. Do not plan a semester from a study-notes site or from a previous year's structure, because these change between offerings.
◆ Question 2 / 6 · The report
What is an econometrics research report actually asking you to produce?
Direct answer: A research report asks you to defend an identification strategy, not to display a technique. The marker wants to know which single relationship you are trying to measure, which other explanations could produce the same number, and what in your design rules those explanations out.
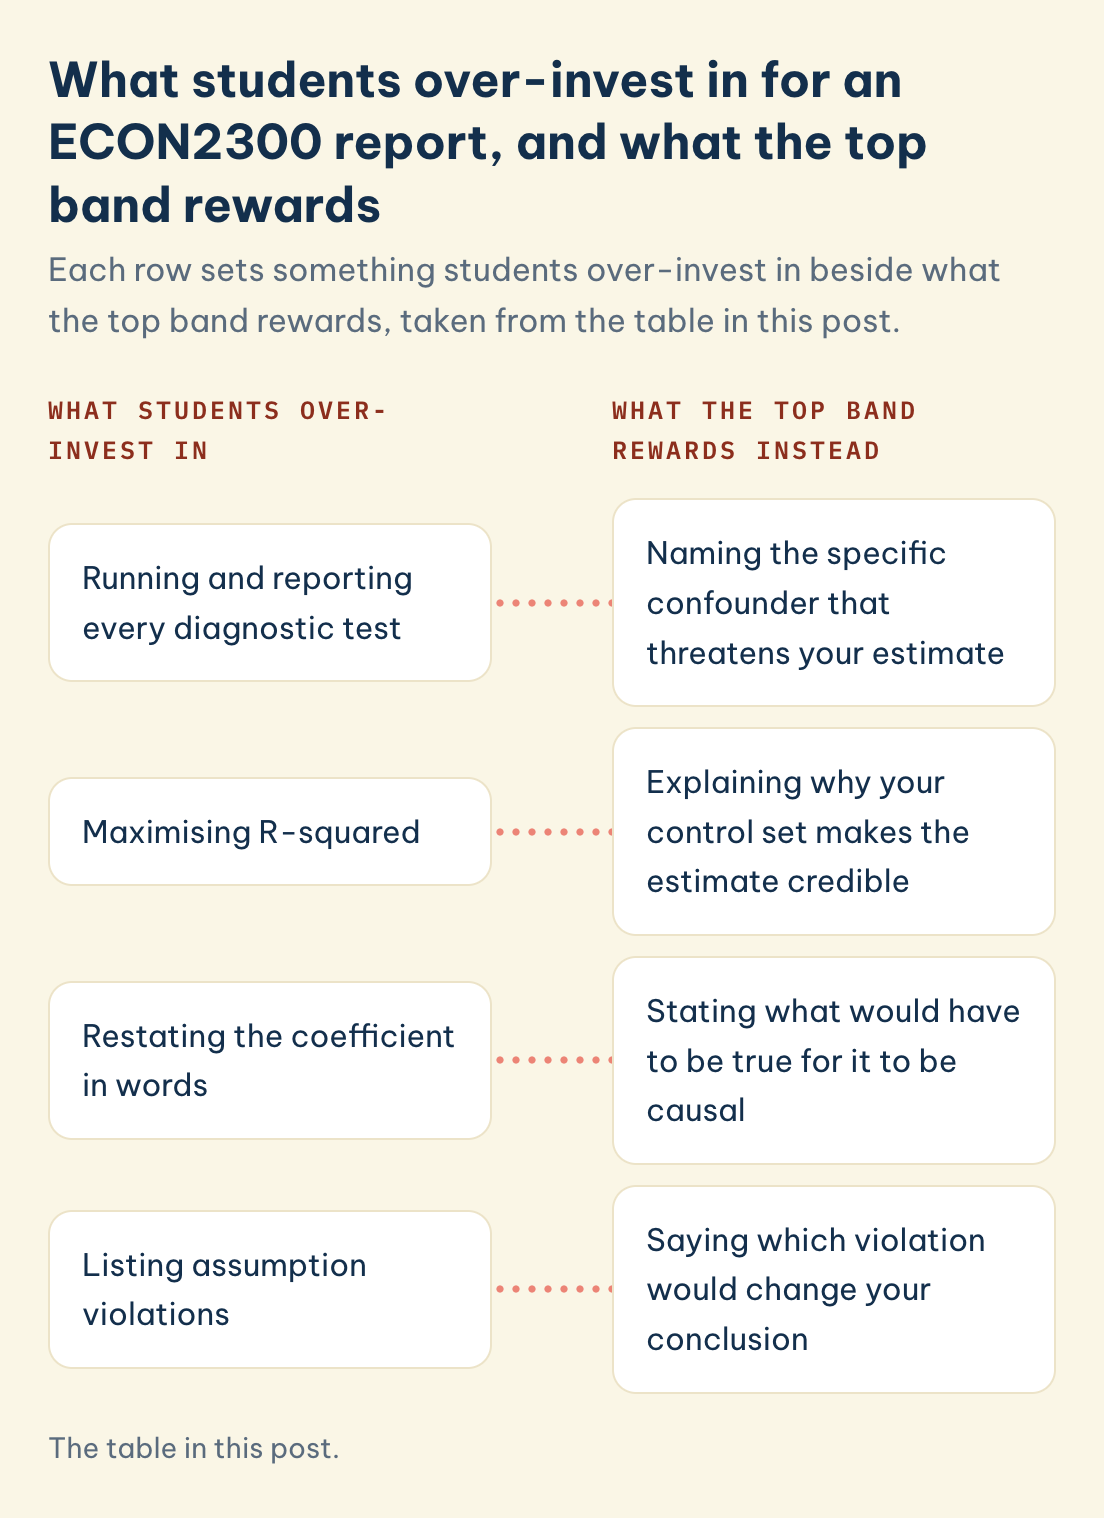
What students over-invest in for an ECON2300 report, and what the top band rewards
Each row sets something students over-invest in beside what the top band rewards, taken from the table in this post.
What students over-invest in
What the top band rewards instead
Running and reporting every diagnostic test
Naming the specific confounder that threatens your estimate
Maximising R-squared
Explaining why your control set makes the estimate credible
Restating the coefficient in words
Stating what would have to be true for it to be causal
Listing assumption violations
Saying which violation would change your conclusion
Save this figure
Evidence: Everything else in the report, including the model, the diagnostics and the tables, exists to support that defence. Course content and marking criteria pull in different directions here, and the tension is documented. Angrist and Pischke (2017) bought and coded the content of 12 undergraduate econometrics textbooks and collected syllabuses from 38 institutions across 8 categories of university, publishing the results in the Journal of Economic Perspectives in 2017. In the classic texts, the single most heavily covered topic in their taxonomy was Assumption Failures and Fix-ups at roughly 20 percent of page space. Regression Properties took 11 to 12 percent, and Regression Inference roughly 13 percent. Empirical examples using real data occupied about 15 percent of pages in the classics, rising to an average of 24.4 percent in contemporary texts. Simultaneous Equations Models still consumed 14 percent of page space in the more elementary texts, rising to 18 percent once more advanced books entered the sample, while Panel Data received little attention across the board. Their syllabus sample was built by taking the 10 largest campuses in each of eight institution types, most syllabuses dating from 2014 or later and the oldest from 2009. Their conclusion is blunt: "Regression should be taught the way it's now most often used: as a tool to control for confounding factors."
Example: Two students submitted reports on the same wage dataset. The first spent 600 words on heteroskedasticity tests and corrections and 80 words justifying the control variables, and lost marks in 2 criteria. The second spent 200 words on diagnostics and the remaining 1200 arguing why, within groups defined by her controls, schooling could be treated as if assigned independently of ability. The second report answered the question the rubric asked.
| What students over-invest in | What the top band rewards |
|---|---|
| Running and reporting every diagnostic test | Naming the specific confounder that threatens your estimate |
| Maximising R-squared | Explaining why your control set makes the estimate credible |
| Restating the coefficient in words | Stating what would have to be true for it to be causal |
| Listing assumption violations | Saying which violation would change your conclusion |
◆ Question 3 / 6 · Interpreting coefficients
How do you interpret a regression coefficient so it earns marks?
Direct answer: Write the interpretation in three parts. State the size and the units, state the comparison being made, and state the claim you are and are not making. A sentence that omits the second part is where most marks are lost.
Evidence: The phrase "a one unit increase in X is associated with a beta increase in Y" is only meaningful once you say holding what constant, and among whom. The notation itself invites the slip. Chen and Pearl (2013), surveying 6 influential econometrics textbooks in the Real-World Economics Review in 2013, found that the books range from complete denial to partial acceptance of the causal content of econometric equations and "uniformly, fail to provide coherent mathematical notation that distinguishes causal from statistical concepts" (Chen & Pearl, 2013, p. 2). When the textbook uses one symbol for two ideas, a student writing quickly at 2am will use one sentence for both, and the marker reads the stronger of the two. Their survey ran in issue 65 of the journal across pages 2 to 20, and the 6 books they examined include titles still set as core reading in Australian programs.
What to do about it: before you write any interpretation, answer four questions in your notes. What is the unit of X. What is the unit of Y. What is held fixed. Who is in the comparison group. Those 4 answers take 5 minutes and prevent the single most costly sentence in the report. A p-value, conventionally read against a threshold of 5 percent, belongs after all 4 answers rather than instead of them, because statistical significance tells you the estimate is unlikely under a null of no relationship and tells you nothing about whether the relationship is the one you named.
◆ Question 4 / 6 · R in the assessment
How does R fit into the assessment?
Direct answer: In ECON2300 at the University of Queensland, R is the instrument, not the deliverable. Marks attach to the reasoning your code supports, so the code that earns marks is the code a marker can follow from raw data to the number in your table.
Evidence: Assessment tasks in applied econometrics courses commonly present output and ask you to read it, which means fluency in extracting the 4 quantities that populate a results table, the coefficient, the standard error, the test statistic and the p-value, matters more than fluency in writing elegant scripts. Reproducibility is doing more work here than students expect. If your report says a coefficient is 0.043 and your script cannot regenerate that number from the raw file, the report has no evidence behind it, whatever the number is. Goel (2025) makes the same point about notation that applies here to code, an unlabelled object invites the reader to guess. This is also the cheapest insurance against the most common late-semester failure, which is not being able to reconstruct which of six model versions produced the table you already wrote about.
What to do about it: keep 1 script per report, numbered in the order it runs, with a comment above each block saying what question that block answers, which costs about 15 minutes across a whole report. Save the cleaned dataset separately from the raw one in 2 clearly named folders and never edit the raw file. Students who keep 2 files instead of 1 lose roughly 10 minutes setting the habit up and save the hours that a corrupted raw file costs in week 12. When you paste a table into the report, paste the line of code that produced it into your appendix on the same day.
◆ Question 5 / 6 · Data sources
Where should the data for the report come from?
Direct answer: Use a public, documented dataset that someone else can download, because a marker who cannot obtain your data cannot check your table. For Australian topics the standard starting points are the Australian Bureau of Statistics, the Reserve Bank of Australia, and the Australian Data Archive, all 3 free to use.
Evidence: International collections from the World Bank, the Organisation for Economic Co-operation and Development, and the International Monetary Fund serve the same purpose for cross-country topics. Choosing the dataset first and the question second is the most common way a report loses its argument before it is written. A dataset determines which comparisons are even possible, so a question that needs variation your data does not contain cannot be rescued by a better model. Angrist and Pischke (2017) note that empirical illustrations using real data occupy only about 15 percent of pages in the classic textbooks, which means most students reach their first report having read far more about estimators than about how a usable dataset is actually assembled.
Example: A student wanted to estimate the effect of a state policy on youth employment using national quarterly aggregates. Nothing in the data varied across states, so the comparison she needed did not exist in the file. Switching to the state level series in week 3, before writing a word, saved a rewrite in week 10.
What to do about it: before committing, check 3 things in the documentation, the unit of observation, the range of years covered, and whether the variable you care about actually varies within the sample. If any of the 3 is wrong, change the dataset rather than the question.
◆ Question 6 / 6 · Pass versus distinction
What separates a pass from a distinction in the report?
Direct answer: A pass reports what the model found, in the 4 sections a report usually carries, introduction, data, results and conclusion. A distinction also names the strongest objection to that finding and answers it with something specific in the design or the data.
Evidence: The difference is not effort, and it is not word count, it is whether a position appears on the page. The pattern is visible in drafts before it is visible in marks. The distinction Angrist and Pischke (2017) draw between technical concerns and research design shows up directly in the marking. Descriptive writing is confident everywhere and specific nowhere, because it never says which of its own claims is weakest. A report that concedes a limitation and then explains why the limitation does not overturn the main estimate is doing the evaluative work the outcomes ask for, while a report that lists limitations in a closing paragraph without connecting them to the estimate has produced a ritual rather than an argument.
Example: A mentor asked a student to delete every sentence in her conclusion that began "further research could" and replace each one with the specific result that would change her mind. Her word count fell by roughly 250 and the report moved from a competent summary to an argument, because for the first time it said what it would take to be wrong. She replaced 4 closing sentences and changed no numbers at all.
What to do about it: finish your draft, leave it for 24 hours, then write 1 paragraph you will not submit, answering the question "if a marker wanted to reject my main estimate, what is the first thing they would attack?". Whatever you wrote there belongs in the report.
Frequently asked questions
Do I need to be good at mathematics to pass ECON2300?
You need to be comfortable with the statistics you met in your introductory economic statistics course and willing to work with formal notation. The part that trips students up is interpretation rather than derivation, because the same estimate carries different meanings depending on the design behind it.
How much of the course rests on the final exam?
The weighting of every assessment item, and whether any item carries a hurdle requirement, is set in the Electronic Course Profile for your semester. Read the Electronic Course Profile in week 1 and write the numbers down rather than relying on figures quoted on study-notes sites, which are often taken from an earlier offering.
Should I report every diagnostic test I ran?
No. Chen and Pearl (2013) show that even the textbooks blur what a coefficient means, so clarity beats coverage. Report the diagnostics that could change your conclusion, and say what you did about them. A report that lists tests without saying what turned on them reads as coverage rather than analysis.
Can MAAS write my econometrics report for me?
No. MAAS works as an academic advisor under Australian academic integrity expectations, and the report you submit must be your own work. A MAAS mentor can help you clarify your research question, review the logic of your identification strategy, and give feedback on drafts you have written, in the same way a consultation with a tutor works.
Is it acceptable to change my model after seeing the results?
Changing a specification is normal in applied work, and Angrist and Pischke (2017) treat design choices as the substance of the exercise, but the change has to be disclosed. Report all the specifications you tried, ideally in 1 comparison table, and say why you preferred one, because a table showing only the model that produced the result you wanted is not a finding a marker can trust.
References
Angrist, J. D., & Pischke, J.-S. (2017). Undergraduate econometrics instruction: Through our classes, darkly. Journal of Economic Perspectives, 31(2), 125–144.
Chen, B., & Pearl, J. (2013). Regression and causation: A critical examination of six econometrics textbooks. Real-World Economics Review, 65, 2–20.
Goel, D. (2025). Estimator of what? A note on teaching regressions in introductory econometrics (IZA Discussion Paper No. 18007). Institute of Labor Economics.
Tools & resources
- MAAS academic support for feedback on a draft you have written.
- MAAS tutoring for working through regression interpretation with a mentor.
A free 20-minute consultation is a conversation about where you are with ECON2300.
Book a free consultation ▸