
◆ Research Methods
What is the difference between descriptive and inferential statistics?
Descriptive statistics summarise the data you actually collected, while inferential statistics use that sample to draw conclusions about a wider population. Most quantitative dissertations need both, in that order: a descriptive section that tells the marker who and what is in your dataset, followed by tests that answer your research question.
This guide explains each family with dissertation examples, why the word "inferential" is used, which common tests (including ANOVA) belong where, and how to report results so a marker sees the link between the numbers and your hypotheses. If you are still deciding how many participants to recruit, read our guide to calculating sample size for a research study first, because the size of your sample shapes everything inferential.
◆ Question 1 / 8 · Descriptive vs inferential
What is the difference between descriptive and inferential statistics?
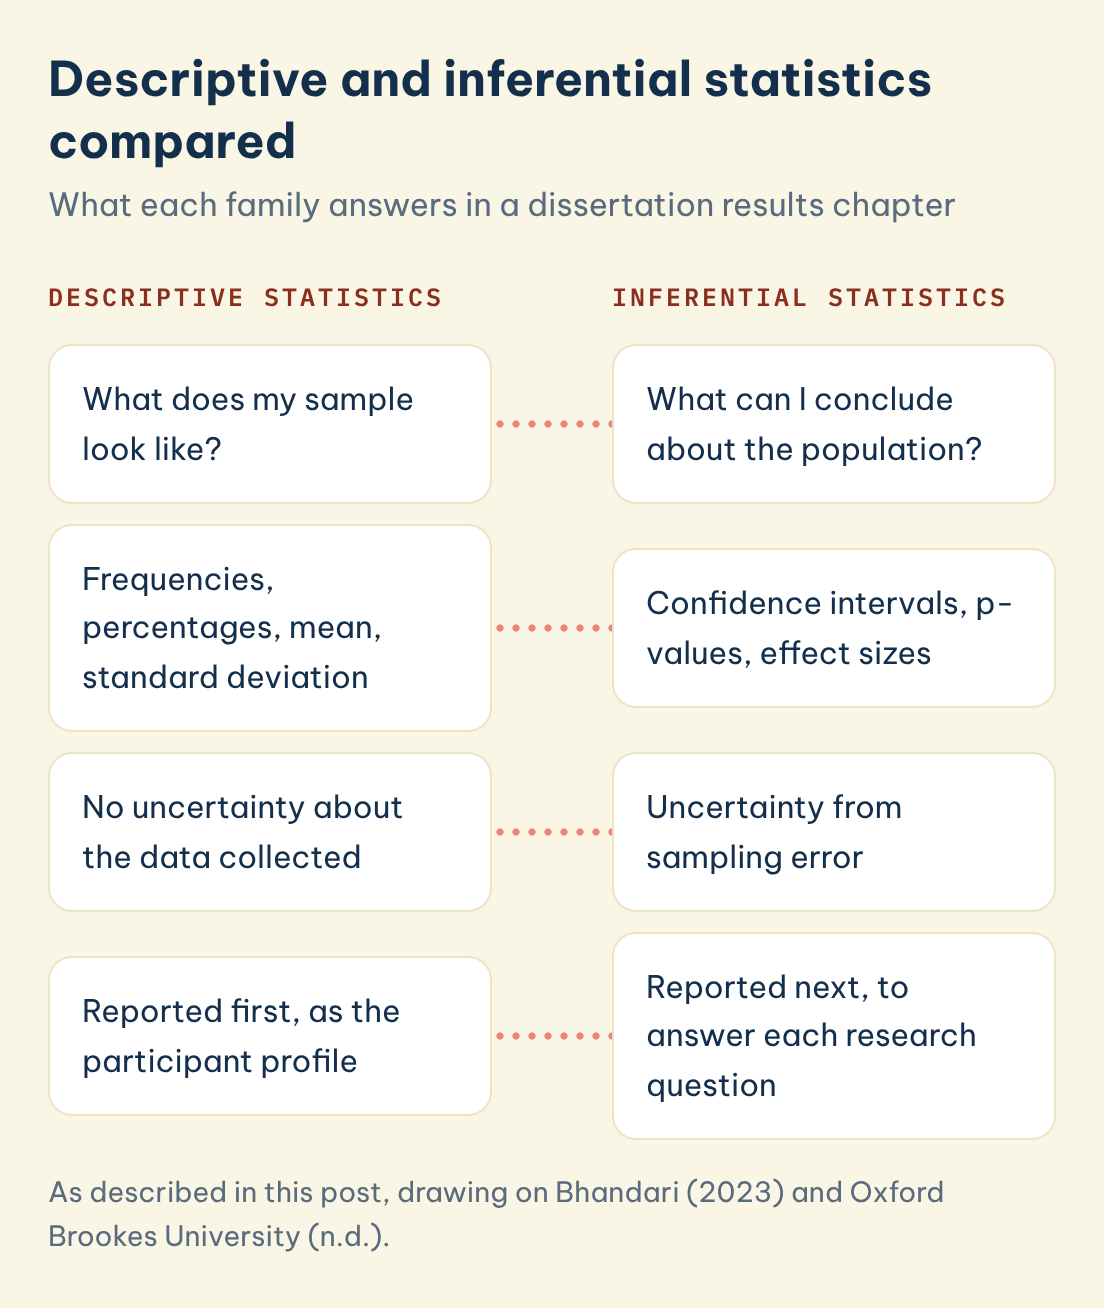
Direct answer: Descriptive statistics describe a dataset through counts, percentages, averages and measures of spread, with no claim beyond the people you measured. Inferential statistics use a sample to estimate population values and test hypotheses, so they always carry uncertainty from sampling error, expressed through confidence intervals and p-values.
Bhandari (2023) puts the contrast in one line: "While descriptive statistics summarise the characteristics of a data set, inferential statistics help you come to conclusions and make predictions based on your data." The same Scribbr guide adds that in descriptive statistics there is no uncertainty. Inferential statistics carry uncertainty because a sample is never the whole population, and the gap between them is sampling error. That difference is the practical test for any number in your results chapter: if the number only describes your respondents, it is descriptive, and if it claims something about everyone like them, it is inferential. If you are deciding which summary figures belong in the first part of your results chapter, read what descriptive statistics to report in a dissertation.
| Feature | Descriptive statistics | Inferential statistics |
|---|---|---|
| Question answered | What does my sample look like? | What can I conclude about the population? |
| Typical outputs | Frequencies, percentages, mean, median, standard deviation | Confidence intervals, p-values, test statistics, effect sizes |
| Uncertainty | None about the data collected | Always present, from sampling error |
| Dissertation location | Opening of the results chapter, participant profile | Hypothesis tests that answer the research questions |
| Example | 62% of 180 respondents use the library weekly | Weekly users report higher satisfaction than non-users in the student population |
Descriptive and inferential statistics compared
What each family answers in a dissertation results chapter
Descriptive statistics
Inferential statistics
What does my sample look like?
What can I conclude about the population?
Frequencies, percentages, mean, standard deviation
Confidence intervals, p-values, effect sizes
No uncertainty about the data collected
Uncertainty from sampling error
Reported first, as the participant profile
Reported next, to answer each research question
Save this figure
◆ Question 2 / 8 · Inferential with an example
What is inferential statistics with an example?
Direct answer: Inferential statistics are methods that generalise from a sample to a population, either by estimating a value such as a population mean or by testing a hypothesis such as a difference between groups. A dissertation example is surveying 180 students and testing whether satisfaction differs between those who study online and on campus.
Oxford Brookes University (n.d.) describes statistical tests as a way to quantify whether there is an association, a difference or a relationship between variables, performed on sample data "with the aim of inferring beyond the sample data to the wider population." Bhandari (2023) separates the 2 main uses: making estimates about populations and testing hypotheses to draw conclusions about them. In a business dissertation, the estimate might be the average weekly hours that graduate employees spend on unpaid overtime, reported with a 95% confidence interval. The hypothesis test might ask whether that average differs between sectors. Both rest on the same condition, which Bhandari (2023) states plainly: if your sample is not representative of your population, you cannot make valid statistical inferences or generalise.
◆ Question 3 / 8 · Why inferential
Why is it called inferential statistics?
Direct answer: The name comes from inference, the step of reasoning from evidence you have to a conclusion about something you have not observed directly. You measure a sample, but your research question is about a population, so the statistics infer the population's characteristics from the sample while quantifying how wrong that inference might be.
The gap between sample and population has a name. Bhandari (2023) calls the difference between a true population value (a parameter) and the measured sample value (a statistic) sampling error, and notes that it arises any time you use a sample, even a random and unbiased one. Inferential methods do not remove sampling error, but they put a size on it. A confidence interval gives a range of plausible population values, and a p-value indicates how incompatible the data are with a specified statistical model, which is the first of the 6 principles in the American Statistical Association statement (Wasserstein & Lazar, 2016). Thinking of inference as an argument from evidence, rather than a proof, keeps your discussion chapter appropriately cautious.
A worked example from Bhandari (2023) shows what an interval adds. A sample gives a mean of 19 paid vacation days, which is the point estimate, and a 95% confidence interval of 16 to 22 days, which is the inferential claim. Bhandari explains the 95% as a long-run property: if you repeated the study with a new sample in exactly the same way 100 times, you could expect the estimate to fall within the range about 95 times. Writing your own result in this form, with the estimate first and the interval beside it, tells the marker both what you found and how precisely you found it.
◆ Question 4 / 8 · Is ANOVA inferential
Is ANOVA an inferential statistic?
Direct answer: Yes. ANOVA (analysis of variance) is an inferential test, because it uses sample data to judge whether the means of three or more groups differ in the population. The F statistic and its p-value support that inference, while the group means and standard deviations you report beside it are descriptive.
The University of York (n.d.) data guide groups t-tests, ANOVA and regression together as more involved statistical analysis, in contrast with descriptive statistics such as counts, averages and percentages that a spreadsheet handles well. A common dissertation pattern shows why the distinction matters inside a single analysis. Suppose you compare exam anxiety across 3 year groups. The table of group means is descriptive and tells the marker what you found in your sample. The ANOVA result is inferential and tells the marker whether that pattern is likely to hold beyond your 3 cohorts. Reporting only the F test without the means leaves the reader unable to see the direction or size of the difference.
◆ Question 5 / 8 · 5 dissertation examples
What are 5 examples of inferential statistics in a dissertation?
Direct answer: Five common examples are the independent t-test, one-way ANOVA, the chi-square test of independence, Pearson correlation with a significance test, and linear regression. Each one uses a sample to answer a question about a population: a difference between groups, an association between categories, or a relationship between variables.
| Test | Dissertation question it answers | What you report beside it |
|---|---|---|
| Independent t-test | Do online and campus students differ in mean satisfaction? | Group means, standard deviations, t, p, effect size |
| One-way ANOVA | Does anxiety differ across 3 year groups? | Group means, F, p, effect size |
| Chi-square test of independence | Is gender associated with preferred study mode? | Cross-tabulated counts and percentages, χ² with df, p, Cramér's V |
| Pearson correlation | Are study hours related to marks? | r, p, scatterplot |
| Linear regression | Does social media use predict sleep quality after controlling for age? | Coefficients, confidence intervals, p, R² |
Each row pairs a descriptive output with an inferential one, which mirrors the reporting order Oxford Brookes University (n.d.) recommends: begin with key descriptive statistics such as sample size, demographics, frequencies, averages and measures of spread, then move to the inferential results. Choosing between these tests depends on your variables and assumptions, which our guide to choosing the right statistical test works through step by step.
◆ Question 6 / 8 · Beyond the p-value
Why is a significant p-value not enough?
Direct answer: A p-value tells you whether a result is unlikely under the null hypothesis, but not how large or important the effect is. Report an effect size and a confidence interval with every test, because large samples can make trivial differences statistically significant and small samples can hide meaningful ones.
The American Statistical Association statement is direct on this point: "Scientific conclusions and business or policy decisions should not be based only on whether a p-value passes a specific threshold" (Wasserstein & Lazar, 2016, p. 131). Its fifth principle adds that a p-value, or statistical significance, does not measure the size of an effect or the importance of a result. Sullivan and Feinn (2012) reach the same conclusion for medical education research, arguing that the effect size is the main finding of a quantitative study and that both substantive significance and statistical significance must be reported. Their illustration is the Physicians Health Study, which followed more than 22 000 subjects for an average of 5 years and reported P < .00001, yet the risk difference was only 0.77% with r² = .001, an extremely small effect. A dissertation with 10 000 survey responses faces the same trap on a smaller scale, because Sullivan and Feinn (2012) note that a sample that large is likely to give a significant P value even when the difference between groups is negligible. They also give the benchmark many dissertations use for Cohen's d, where 0.2 is small, 0.5 medium and 0.8 or more large, a convention you should still interpret in the context of your field. For how to word the result itself, see what statistically significant means and how to report it.
◆ Question 7 / 8 · Tools
What tools do students use for inferential statistics?
Direct answer: Common choices for inferential tests include SPSS, R, Stata, jamovi and Python, and a spreadsheet is often enough for descriptive tables (University of York, n.d.). The best choice is normally the software your department teaches, because your supervisor can then check your output and your method.
The ASA statement itself grew out of questions George Cobb of Mount Holyoke College posed to an ASA forum in February 2014, and Wasserstein, tasked by the ASA Board, reached out to more than two dozen people before the statement was posted online on 7 March 2016 (Wasserstein & Lazar, 2016). The University of York (n.d.) guide recommends specialist software or code for t-tests, ANOVA and regression and advises using an approach you have been taught, or that your supervisor or department uses. The University of Exeter (n.d.) writing-up guide lists SPSS, Excel and R as analysis tools and adds a reminder worth keeping on your desk: these tools can help you organise, calculate and visualise your data, but they do not replace your critical thinking. Whichever package you use, keep the syntax or script, because it lets you rerun the analysis if your supervisor asks for a change.
◆ Question 8 / 8 · Mentor help
Can a mentor help with dissertation statistics?
Many students run their own analysis and only need a second pair of eyes on the choices behind it. Through SPSS, R and Python data analysis support at MAAS, a specialist works alongside you on test selection, assumption checks and how to read and report output, with the student involved at every stage from outline to draft to final. Bring your research questions, your variable list and your supervisor's guidance to the first conversation, so the advice fits your actual dataset rather than a textbook example.
Frequently asked questions
Is the mean descriptive or inferential?
A sample mean is descriptive when you use it to summarise your respondents. The same mean becomes part of an inference when you use it as a point estimate of the population mean and attach a confidence interval (Bhandari, 2023).
Do I need inferential statistics if I surveyed the whole population?
Usually not for describing that population. Bhandari (2023) notes that when you collect data from an entire population, you can compare descriptive statistics directly. You may still use inferential tests if you want to generalise beyond that group, for example to future cohorts.
Is a confidence interval descriptive or inferential?
Inferential. A confidence interval estimates a population value from sample data and takes sampling error into account (Bhandari, 2023), and Oxford Brookes University (n.d.) lists it among the results to report.
Is correlation descriptive or inferential?
Both, depending on use. The coefficient r describes the strength of a relationship in your sample, and the significance test attached to it is an inference about the population.
What does p < .05 mean in a dissertation?
It means the data would be unusual if the null hypothesis and the model's assumptions were true. It does not give the probability that your hypothesis is true or measure the size of the effect (Wasserstein & Lazar, 2016).
Which comes first in the results chapter?
Descriptive statistics come first, then the inferential tests that answer each research question, as Oxford Brookes University (n.d.) recommends.
References
Bhandari, P. (2023, January 18). Inferential statistics: An easy introduction & examples. Scribbr. https://www.scribbr.co.uk/stats/inferential-statistics-meaning/
Oxford Brookes University. (n.d.). Inferential statistics. https://www.brookes.ac.uk/students/academic-development/maths-and-stats/statistics/inferential-statistics
Sullivan, G. M., & Feinn, R. (2012). Using effect size, or why the P value is not enough. Journal of Graduate Medical Education, 4(3), 279–282. https://doi.org/10.4300/JGME-D-12-00156.1
University of Exeter. (n.d.). Data management and analysis. Writing up. https://libguides.exeter.ac.uk/writingup
University of York. (n.d.). Quantitative data analysis. Data: A practical guide. https://subjectguides.york.ac.uk/data/quantitative
Wasserstein, R. L., & Lazar, N. A. (2016). The ASA's statement on p-values: Context, process, and purpose. The American Statistician, 70(2), 129–133. https://doi.org/10.1080/00031305.2016.1154108
Not sure how this guide applies to your own case? Talk it through with MAAS in a free 20-minute consultation.
Book a free consultation ▸