
◆ Research Methods
What descriptive statistics should a dissertation report?
Descriptive statistics summarise the sample you actually collected: how many cases you have, what is typical, how spread out the values are and how the categories split. Every quantitative dissertation needs them, even when the research questions are answered by a regression or a t test, because descriptive statistics are still used to give a general summary when the main aim is inferential (Kaliyadan & Kulkarni, 2019), and a reader needs that summary to judge the main result.
This guide explains what the term means, the main types of descriptive statistics, which figures a dissertation should report and in what form, how descriptive and inferential statistics differ, and where ANOVA fits. It closes with a worked table, a short SPSS route and a checklist you can hold your results chapter against. If you are still choosing the analysis itself, read how to choose the right statistical test first.
◆ Question 1 / 9 · Meaning
What does descriptive statistics mean?
Direct answer: Descriptive statistics are numbers, tables and charts that summarise a sample without drawing conclusions about a wider population. Kaliyadan and Kulkarni (2019) describe them as giving a summary of the sample studied without inferences based on probability theory. The mean, the standard deviation and a frequency table are typical examples.
Curtin University Library (n.d.) draws the same line from the student side: descriptive statistics summarise and describe the variables in a sample, as opposed to drawing conclusions about the larger population the sample came from, which is the job of inferential statistics. Curtin University Library (n.d.) illustrates the categorical case with a sample of 80 people: 91.3% were single or married, 7 people chose the option other, and the relative frequency of married people was 0.36. Each of those statements is descriptive, because it reports the sample and claims nothing beyond it. The practical consequence is simple. A descriptive figure is a fact about your data set, so it needs no p value and no confidence claim, but it does need to be accurate, complete and labelled with the sample size it rests on.
Descriptive statistics can describe one variable at a time (univariate analysis) or the relationship between two or more variables, for example through a scatter plot (Kaliyadan & Kulkarni, 2019) or a cross-tabulation of two categorical variables (Curtin University Library, n.d.). In a dissertation, the univariate summaries usually come first, and the bivariate ones appear where they help the reader understand the variables before the main tests.
◆ Question 2 / 9 · Four types
What are the four main types of descriptive statistics?
Direct answer: Many teaching guides group descriptive statistics into measures of frequency, central tendency, dispersion and position. Mishra et al. (2019) name frequency, central tendency and dispersion as the three major types, and list quartiles and percentiles within dispersion. Many courses split those position measures out, which gives the four types students are usually taught.
Mishra et al. (2019), six authors writing in the Annals of Cardiac Anaesthesia, list the contents of each group in detail. Frequency covers counts and percentages, central tendency covers the mean, median and mode, and dispersion covers the variance, standard deviation, standard error, quartiles, interquartile range, percentiles, range and coefficient of variation. They also add a rule that decides which group you use for which variable: frequencies are usually used for categorical data, while the other measures are used for quantitative data. Counts and percentages are easiest to present with a frequency distribution table.
| Type | What it tells the reader | Typical measures | Use it for |
|---|---|---|---|
| Frequency | How often each category occurs | Count (n), percentage | Gender, programme, Likert categories, yes/no items |
| Central tendency | What a typical value is | Mean, median, mode | Age, scores, scale totals |
| Dispersion | How spread out the values are | Standard deviation, range, variance | Any continuous variable reported with a mean |
| Position | Where a value sits in the distribution | Quartiles, percentiles | Skewed variables and outlier checks |
The table is a guide to choice, not a list to fill in for every variable. A variable such as programme of study needs only counts and percentages, while a continuous outcome needs a measure of centre together with a measure of spread. If you are unsure which centre to quote for a variable, mean, median and mode: choosing the right measure explains the choice.
◆ Question 3 / 9 · What to report
What descriptive statistics should a dissertation report?
Direct answer: Report the sample size, the characteristics of the participants, and the descriptive summary of every variable used in your main analyses, including any subgroups you compare. The APA reporting standards ask for the number of cases, means, standard deviations and the extent of missing data, so a reader can check the analysis.
The Journal Article Reporting Standards for quantitative research, published in 2018 in American Psychologist by a six-member task force of the APA Publications and Communications Board (Appelbaum et al., 2018), are the most detailed published checklist, and they can serve as a benchmark outside psychology too. For the results, they ask for a description of each primary and secondary outcome for the total sample and for each subgroup, giving the number of cases, the cell means, the standard deviations and other measures that characterise the data (Appelbaum et al., 2018). The same table of standards asks you to report the frequency or percentages of missing data and the major demographic characteristics of the sample, such as age and sex.
In a dissertation this usually translates into four pieces of writing:
- Sample description: the final n, how many cases were excluded and why, and a demographic table in counts and percentages.
- Variable summaries: a mean and standard deviation (or median and interquartile range) for every continuous variable in the analysis, with the n behind each figure.
- Subgroup summaries: the same figures for each group you compare, so the reader can see the size and direction of the difference before reading the test.
- Data screening: missing data, outliers and the shape of each distribution, because these decide which inferential test is appropriate.
A common gap is reporting a test result, such as a t statistic, for a comparison whose group means and standard deviations appear nowhere in the chapter. The descriptive figures are what make that test result interpretable, so they belong in the same chapter and preferably in the same table.
◆ Question 4 / 9 · Mean or median
Should you report the mean and SD or the median and IQR?
Direct answer: Report the mean and standard deviation when a continuous variable is roughly symmetrical, and the median and interquartile range when it is skewed or has outliers. Mishra et al. (2019) note that the mean is affected by extreme values while the median is not, which is the main reason for the switch.
The choice should follow from your data screening rather than from habit. A histogram or box plot shows the shape of each distribution (Curtin University Library, n.d.), and if one long tail pulls the mean away from where most cases sit, the median gives the reader a more honest picture of the typical value. Income, time on task and counts of events are frequent examples of skewed variables in student projects.
The choice of summary also links to the choice of test. Students often move to a non-parametric test for a skewed variable and then describe the result purely as a difference in medians, but that reading needs care. Hart (2001) warns: "Whereas a t test is a test of population means, the Mann-Whitney test is commonly regarded as a test of population medians. This is not strictly true, and treating it as such can lead to inadequate analysis of data" (p. 391). Reporting the median and interquartile range for each group, alongside the test, lets the reader see differences in spread as well as in the typical value.
◆ Question 5 / 9 · The table
What does a descriptive statistics table look like?
Direct answer: A descriptive statistics table lists each variable in rows and the summary measures in columns, usually n, M and SD, with a note giving the total sample size. APA Style keeps a set of sample tables, including a demographic table in counts and percentages and a table of descriptive statistics and correlations.
The American Psychological Association (n.d.) recommends using a standard table format where possible, because readers know where to look for the information, and it offers 8 sample tables. Its sample demographic table reports each characteristic as n and % for every condition and for the full sample, and its correlation table places n, M and SD for each variable before the correlation columns. The APA demographic example describes N = 150 participants, n = 50 in each of three conditions, with 68 women (45%) and 82 men (55%) in the full sample, and puts the mean age of 39.5 years (SD = 10.1) in the table note. Its correlation example reports n, M and SD for 7 variables, with sample sizes from 694 to 3,697, which shows that n can differ between variables. A minimal version for a dissertation might look like this, with illustrative figures only:
| Variable | n | M | SD | Range |
|---|---|---|---|---|
| Age (years) | 212 | 24.6 | 4.1 | 19–41 |
| Weekly study hours | 208 | 13.2 | 6.8 | 2–38 |
| Academic self-efficacy (1–7) | 212 | 4.9 | 1.1 | 1.8–7.0 |
Note. N = 212. Four participants did not report weekly study hours. Figures are invented for illustration.
Mishra et al. (2019) show what a full set of descriptive output for one variable looks like in practice. For mean arterial pressure in 15 patients they report a mean of 97.47 with a standard deviation of 11.01, a median of 95, quartiles of 88 and 107, an interquartile range of 19 and a range of 82 to 116. Nobody needs every one of these figures in a results chapter, so the skill lies in choosing the two or three that answer the reader's question. The same paper reports the standard error (2.84), the mode (116) and the coefficient of variation (11.3%) for that variable, and for the categorical variable sex it gives 8 males (53.3%) and 7 females (46.7%) out of 15, which is exactly the counts-and-percentages format a demographic table uses.
◆ Question 6 / 9 · Descriptive vs inferential
What is the difference between descriptive and inferential statistics?
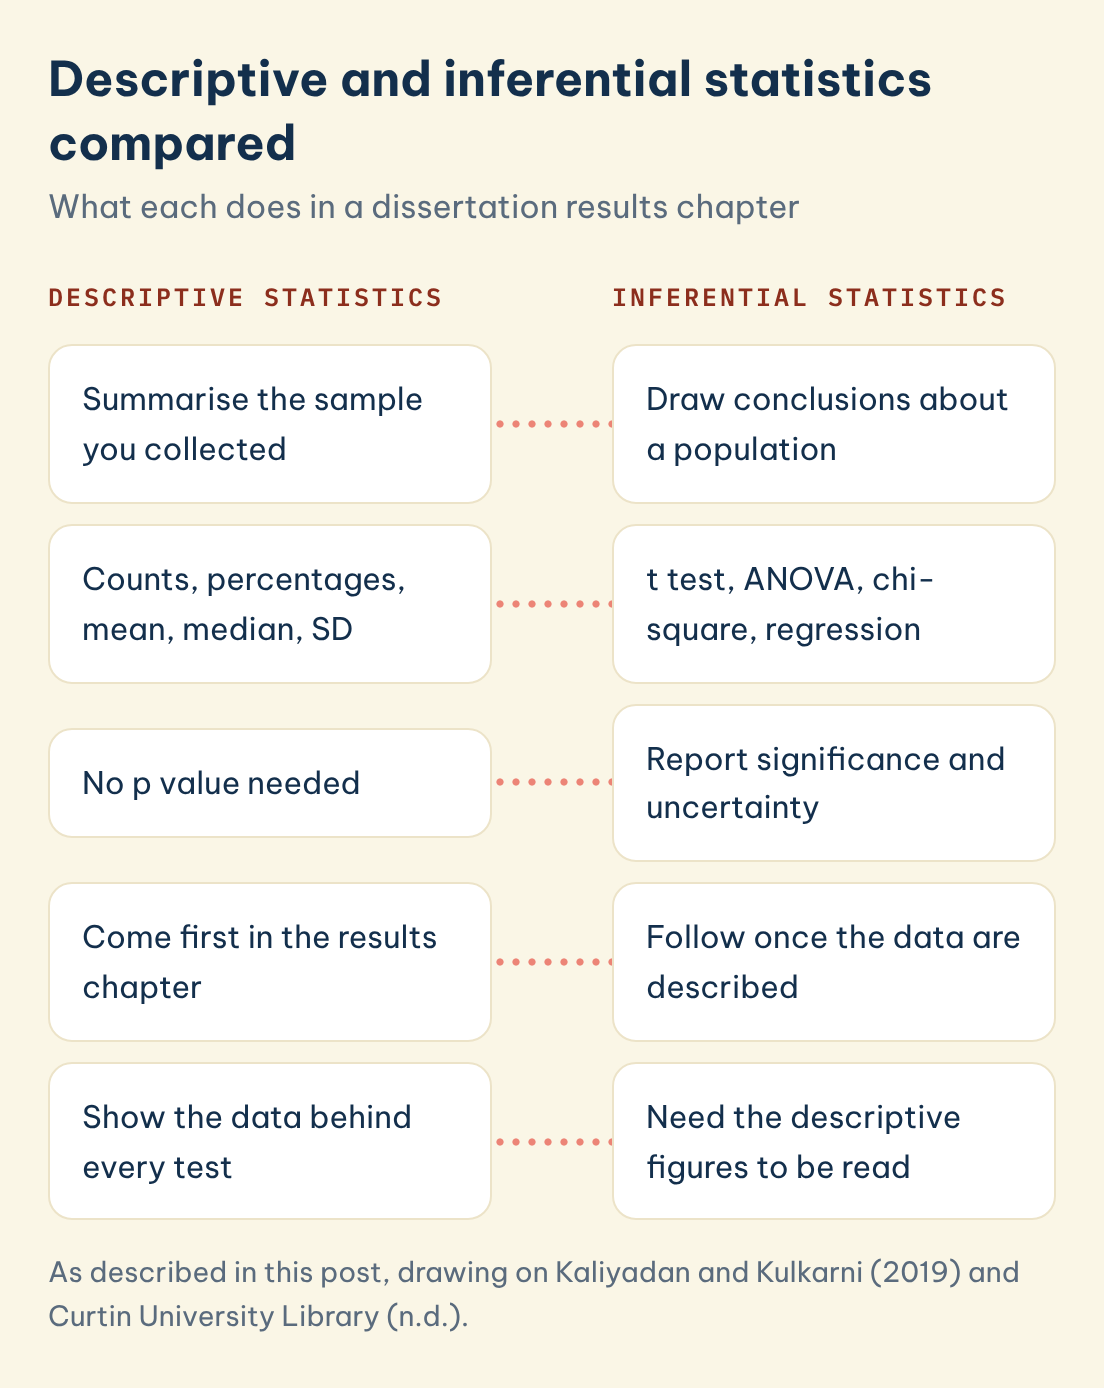
Direct answer: Descriptive statistics summarise the sample you have, while inferential statistics use that sample to draw conclusions about a population, with a stated level of uncertainty. Kaliyadan and Kulkarni (2019) draw this line explicitly. A mean is descriptive, while a t test comparing two means and reporting statistical significance is inferential.
Writing in the Indian Dermatology Online Journal in 2019, Kaliyadan and Kulkarni make the point that even when the primary aim of a study is inferential, descriptive statistics are still used to give a general summary. In a dissertation the two therefore work in sequence. The descriptive section tells the reader who took part and what the variables look like, and the inferential section tests the hypotheses. If the descriptive figures are missing, a marker cannot judge whether a significant result is large enough to matter.
Descriptive and inferential statistics compared
What each does in a dissertation results chapter
Descriptive statistics
Inferential statistics
Summarise the sample you collected
Draw conclusions about a population
Counts, percentages, mean, median, SD
t test, ANOVA, chi-square, regression
No p value needed
Report significance and uncertainty
Come first in the results chapter
Follow once the data are described
Show the data behind every test
Need the descriptive figures to be read
Save this figure
◆ Question 7 / 9 · ANOVA
Is ANOVA an example of descriptive statistics?
Direct answer: No. ANOVA is an inferential test that compares the means of two or more groups (usually three or more, since two groups are often compared with a t test) and reports whether the differences are statistically significant. The group means and standard deviations that ANOVA compares are descriptive statistics, and they should be reported alongside the test.
The confusion is understandable, because ANOVA output in most software prints a descriptive table before the test table. Report that descriptive table, either in your text or as a table with n, M and SD for each group, and then report the F test as part of your inferential results. The same logic applies to a t test, a chi-square test and a correlation: each has descriptive figures underneath it that the reader needs to see.
◆ Question 8 / 9 · In SPSS
How do you get descriptive statistics in SPSS?
Direct answer: In SPSS, use Analyze, then Descriptive Statistics, then Frequencies for categorical variables or Descriptives for continuous ones. Mishra et al. (2019) give this route, and the Frequencies dialogue can also produce quartiles, percentiles and a histogram for checking the shape of a distribution.
For group comparisons, the Explore option under the same menu reports the mean, median, standard deviation and interquartile range for each group and draws box plots, which makes it the fastest way to check outliers before choosing a test. Whichever software you use, copy the figures into a properly formatted table rather than pasting raw output, and round consistently.
◆ Question 9 / 9 · Expert help
Can an expert help you report descriptive statistics?
Most students can produce descriptive statistics themselves once they know which figures their design needs, and building that skill is worth the effort. Help is useful when the data are messy, when you are unsure whether a variable should be summarised with a mean or a median, or when your supervisor has asked for a results chapter that matches a reporting standard. MAAS has supported students since 2015 with a network of more than 100 experts. Through SPSS, R and Python help in your discipline, a MAAS expert works with you on your own data, explains the output and reviews how you report it, so you can defend each figure in your viva or marking. Our guide to thesis statistics help explains which kinds of support a university normally allows and which parts of the analysis must stay your own.
Frequently asked questions
What are 5 examples of descriptive statistics?
The mean, median, mode, standard deviation and percentage are five common examples. Mishra et al. (2019) also list the range, variance, standard error, quartiles, interquartile range and coefficient of variation.
Do I need descriptive statistics if my dissertation is about a regression model?
Yes. Kaliyadan and Kulkarni (2019) note that descriptive statistics are still used to give a general summary when the main aim is inferential, and the reporting standards ask for means and standard deviations for every outcome, plus the extent of missing data (Appelbaum et al., 2018).
Should descriptive statistics go in the methods or the results chapter?
Sample characteristics are often summarised in the methods chapter, while descriptive statistics for the study variables usually open the results chapter. Check your department's handbook, because conventions differ between disciplines.
How should I report descriptive statistics for Likert items?
Report counts and percentages for each response category, because frequencies are used for categorical data (Mishra et al., 2019). If you combine several items into a scale score, you can report the mean and standard deviation of the scale.
Can I make a descriptive statistics table in Excel?
Yes. Excel can compute counts, means and standard deviations, and Oxford Brookes University's descriptive statistics page links to guidance on building tables and charts in both Excel and SPSS.
How many decimal places should descriptive statistics have?
Choose a level of precision that matches the measurement and use it consistently within each table. One or two decimal places is common for means and standard deviations, and the APA sample tables show percentages as whole numbers (American Psychological Association, n.d.).
References
American Psychological Association. (n.d.). Sample tables. APA Style. https://apastyle.apa.org/style-grammar-guidelines/tables-figures/sample-tables
Appelbaum, M., Cooper, H., Kline, R. B., Mayo-Wilson, E., Nezu, A. M., & Rao, S. M. (2018). Journal article reporting standards for quantitative research in psychology: The APA Publications and Communications Board task force report. American Psychologist, 73(1), 3–25. https://doi.org/10.1037/amp0000191
Curtin University Library. (n.d.). Descriptive statistics. UniSkills. https://uniskills.library.curtin.edu.au/numeracy/statistics/descriptive/
Hart, A. (2001). Mann-Whitney test is not just a test of medians: Differences in spread can be important. BMJ, 323(7309), 391–393. https://doi.org/10.1136/bmj.323.7309.391
Kaliyadan, F., & Kulkarni, V. (2019). Types of variables, descriptive statistics, and sample size. Indian Dermatology Online Journal, 10(1), 82–86. https://doi.org/10.4103/idoj.IDOJ_468_18
Mishra, P., Pandey, C. M., Singh, U., Gupta, A., Sahu, C., & Keshri, A. (2019). Descriptive statistics and normality tests for statistical data. Annals of Cardiac Anaesthesia, 22(1), 67–72. https://doi.org/10.4103/aca.ACA_157_18
Tools & resources
Not sure how this guide applies to your own case? Talk it through with MAAS in a free 20-minute consultation.
Book a free consultation ▸