
◆ Research Methods
What does statistically significant mean, and how do you report it?
A result is statistically significant when its p-value falls below the significance level you set before collecting data, usually .05. Tenny and Abdelgawad (2023) state the rule plainly: a P value less than a predetermined alpha counts as significant. That tells you the data sit poorly with the null hypothesis, not that the effect is large or important.
◆ Question 1 / 6 · Meaning
What does it mean to be statistically significant?
Direct answer: Statistically significant means the p-value from your test is smaller than the alpha you fixed in advance. Under the assumption that the null hypothesis is true, data as extreme as yours would be unusual. Wasserstein and Lazar (2016) stress that a p-value measures incompatibility with a model, not the truth of a hypothesis.
Every significance test starts from a null hypothesis, normally the claim that there is no difference or no relationship. Your software then computes a p-value, which the American Statistical Association defines informally as the probability under a specified statistical model that a statistical summary of the data would be equal to or more extreme than its observed value (Wasserstein & Lazar, 2016). When that probability is below alpha, you reject the null hypothesis and call the result significant. The first of the six principles in the American Statistical Association statement says that p-values can indicate how incompatible the data are with a specified statistical model (Wasserstein & Lazar, 2016). Alpha is also the false-positive rate you accept: at alpha = .05, if the null hypothesis were true in every study, about 5% of tests would still come out significant by chance alone, and at alpha = .01 about 1% would (Tenny & Abdelgawad, 2023). The word "significant" is therefore a technical label for a decision rule, and in everyday English it sounds far stronger than it is. Greenland et al. (2016) point out that the statistical meanings of "significance" and "confidence" are at odds with their ordinary English sense, which is exactly why examiners pick on loose wording in a results chapter.
◆ Question 2 / 6 · 0.05 vs 0.01
Is 0.05 statistically significant, and is 0.01 or 0.05 more significant?
Direct answer: A p-value of exactly .05 is not significant at alpha = .05, because the rule requires p to be smaller than alpha. Between the two thresholds, .01 is the stricter one: a result that passes .01 also passes .05. A smaller p signals stronger evidence against the null, not a bigger effect.
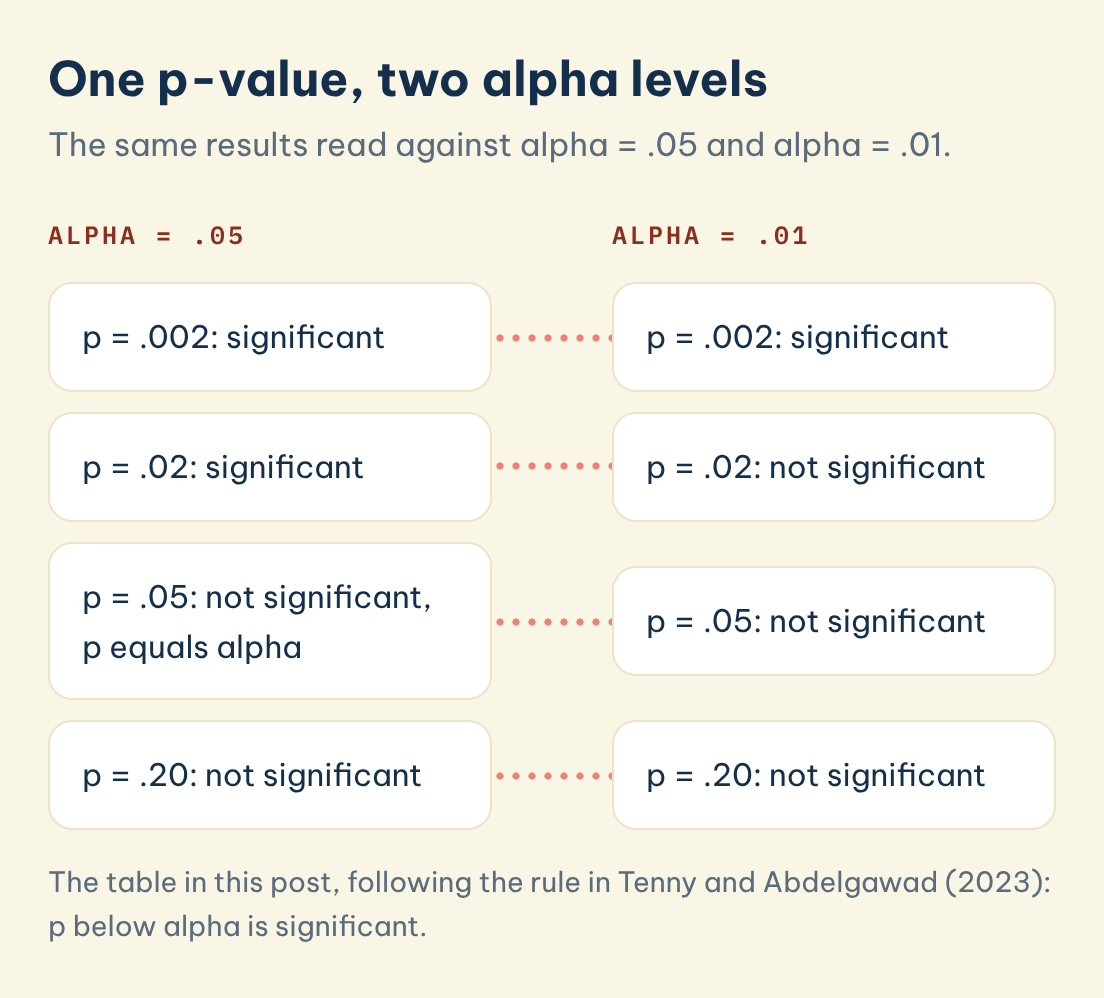
Tenny and Abdelgawad (2023) give the two cases in one line each: a P value less than alpha is significant, and a P value greater than or equal to alpha is not. So a p-value of .02 is significant when alpha is .05, yet the same .02 fails when the researcher had chosen alpha = .01. The authors stress that 0.05 is a convention rather than a mathematical rule, and that alpha should be fixed before any data are collected so that it cannot be adjusted to make a result look significant. In other words, alpha = .05 accepts a 5% risk of a false positive and alpha = .01 accepts a 1% risk, so the stricter threshold trades fewer false positives for lower statistical power. The table below shows how one p-value can lead to different decisions, so state your alpha in the methods chapter before you report any test.
| p-value | Alpha = .05 | Alpha = .01 |
|---|---|---|
| p = .002 | Significant | Significant |
| p = .02 | Significant | Not significant |
| p = .05 | Not significant (p equals alpha) | Not significant |
| p = .20 | Not significant | Not significant |
One p-value, two alpha levels
The same results read against alpha = .05 and alpha = .01.
Alpha = .05
Alpha = .01
p = .002: significant
p = .002: significant
p = .02: significant
p = .02: not significant
p = .05: not significant, p equals alpha
p = .05: not significant
p = .20: not significant
p = .20: not significant
Save this figure
◆ Question 3 / 6 · Significant or not
What is the difference between statistically significant and not statistically significant?
Direct answer: A significant result means the data are hard to reconcile with the null hypothesis at your chosen alpha. A non-significant result means your study could not rule the null out, which is different from showing there is no effect. Greenland et al. (2016) list "no effect" readings of large p-values among common misinterpretations.
Students often write "there was no difference between the groups" after a p-value of .20, and examiners often question this because the test cannot support that sentence. A large p-value can come from a small sample, noisy measurement, or a real but modest effect that the study lacked power to detect. Greenland et al. (2016) argue that the arbitrary classification of results into significant and non-significant is unnecessary for, and often damaging to, valid interpretation, and that estimating the size of effects and the uncertainty around them matters far more. Gelman and Stern (2006) make a related point in their title: the difference between "significant" and "not significant" is not itself statistically significant. If one subgroup gives p = .04 and another gives p = .06, you cannot conclude that the two subgroups differ; you would need to test that difference directly. With 40 participants per subgroup, a correlation of r = .32 gives about p = .04, while r = .30 gives about p = .06, so a gap of 0.02 in the coefficient flips the label. A safer phrasing for a non-significant result is "the difference was not statistically significant", followed by the estimate and its confidence interval.
◆ Question 4 / 6 · A 5% difference
Is a 5% difference significant?
Direct answer: A percentage difference alone cannot tell you. Whether a 5% gap is significant depends on the sample size and the variability of the data, and whether it matters depends on the context. Sullivan and Feinn (2012) note that with a large enough sample almost any difference will reach significance.
Significance is a joint product of effect size, variability and sample size. A 5% difference in exam marks between two classes of 15 students each may give a large p-value, while the same 5% across 3,000 survey respondents may give p < .001. Take a concrete case: two groups with means of 60 and 63 marks and a standard deviation of 12 have a Cohen's d of 0.25. With 15 students per group, an independent t-test gives roughly p = .50; with 1,500 per group, the same d = 0.25 gives p < .001. The effect is identical in both studies, and only the sample size changed. Sullivan and Feinn (2012) warn that a p-value can show whether an effect exists but does not reveal its size, and they call the effect size the main finding of a quantitative study. The American Statistical Association makes the same point in its fifth principle: a p-value, or statistical significance, does not measure the size of an effect or the importance of a result (Wasserstein & Lazar, 2016). This is the line between statistical significance and practical significance. To judge practical significance, report an effect size such as Cohen's d or a mean difference, and discuss what that size means for your field. Our guide on how to report effect size and confidence intervals walks through that step in detail.
◆ Question 5 / 6 · APA 7 reporting
How do you report a statistically significant result in APA 7?
Direct answer: Give the test statistic with its degrees of freedom, the exact p-value to two or three decimals, and an effect size. Write p in italics with no zero before the decimal point, and write p < .001 when the value is smaller. Never write p = .000, even if your software prints it.
A complete results sentence reads like this: "Students who received weekly feedback scored higher than the control group, t(58) = 2.41, p = .019, d = 0.62, 95% CI [0.10, 1.14]." The American Psychological Association (n.d.) numbers and statistics guide asks writers to use italics for letters used as statistical symbols, and APA style drops the leading zero for values that cannot exceed one, which includes p. In this example the 95% confidence interval for d runs from 0.10 to 1.14, so the data are compatible with anything from a very small effect to a very large one, which a reader learns only from the interval (Greenland et al., 2016). The interval and the effect size carry the information that the p-value lacks. The American Statistical Association warns that "Scientific conclusions and business or policy decisions should not be based only on whether a p-value passes a specific threshold" (Wasserstein & Lazar, 2016, p. 131), so a sentence that offers only "p < .05" gives a marker very little. State the alpha once in your methods section, report exact values in the results, and keep the word "significant" for its technical meaning. If you are still deciding which test produced the number, choosing the right statistical test covers that earlier decision.
◆ Question 6 / 6 · Using the phrase
Should you still use the phrase "statistically significant"?
Direct answer: Many programmes and journals still accept it, so you can use it, as long as you report exact p-values and effect sizes beside it. Some statisticians now recommend dropping the phrase altogether. Check your module handbook or target journal, and follow the convention your marker or editor asks for.
Wasserstein, Schirm and Lazar (2019) wrote an editorial for a special issue of The American Statistician with 43 papers on inference, and concluded that it is time to stop using the term "statistically significant" entirely. The editorial appeared in March 2019, three years after the 2016 statement, and it summarised the 43 papers in an editorial titled "Moving to a world beyond 'p < 0.05'" (Wasserstein et al., 2019). A note later attached to the editorial clarifies that it reflects the views of its three authors, not an endorsed position of the American Statistical Association. In practice, many marking rubrics and journal templates still use the term, so removing it from a dissertation can look like an omission. The safer course is to keep the phrase but never let it stand alone. Pair each significant or non-significant label with the estimate, the interval and a sentence on what the size means. If the analysis behind those numbers is the part you are unsure about, SPSS and Python data analysis support from MAAS coaches you through the test choice, the software output and the interpretation, so you can explain every figure in your viva yourself.
Frequently asked questions
Is p = 0.049 significant?
At alpha = .05, yes, because .049 is smaller than .05. Report it as p = .049 and add the effect size, because a value this close to the threshold tells a reader very little on its own.
Is a p-value of 0.06 "marginally significant"?
Many supervisors discourage this phrase, since the rule you set in advance says .06 is not significant. Report the exact value, the estimate and its confidence interval, and let the size of the effect carry your discussion.
Does statistically significant mean the result is important?
No. A significant result can be tiny in practical terms, especially in a large sample. Importance is judged from the effect size and the context of your field.
Does a p-value of .03 mean there is a 3% chance the null hypothesis is true?
No. The American Statistical Association states that p-values do not measure the probability that the studied hypothesis is true. A p-value is computed on the assumption that the null hypothesis holds.
Should I use a one-tailed or a two-tailed test?
Use a two-tailed test unless you stated a directional hypothesis before collecting data and can justify it. Choosing one-tailed after seeing the results to reach significance is poor practice.
Can MAAS check how I have reported my results?
Yes. A MAAS data analysis mentor can review your results chapter with you and explain where the reporting falls short, while you stay the author of the analysis and the text.
References
American Psychological Association. (n.d.). Numbers and statistics guide. APA Style. https://apastyle.apa.org/instructional-aids/numbers-statistics-guide.pdf
Gelman, A., & Stern, H. (2006). The difference between "significant" and "not significant" is not itself statistically significant. The American Statistician, 60(4), 328–331. https://doi.org/10.1198/000313006X152649
Greenland, S., Senn, S. J., Rothman, K. J., Carlin, J. B., Poole, C., Goodman, S. N., & Altman, D. G. (2016). Statistical tests, P values, confidence intervals, and power: A guide to misinterpretations. European Journal of Epidemiology, 31(4), 337–350. https://doi.org/10.1007/s10654-016-0149-3
Sullivan, G. M., & Feinn, R. (2012). Using effect size, or why the P value is not enough. Journal of Graduate Medical Education, 4(3), 279–282. https://doi.org/10.4300/JGME-D-12-00156.1
Tenny, S., & Abdelgawad, I. (2023). Statistical significance. In StatPearls. StatPearls Publishing. https://www.ncbi.nlm.nih.gov/books/NBK459346/
Wasserstein, R. L., & Lazar, N. A. (2016). The ASA statement on p-values: Context, process, and purpose. The American Statistician, 70(2), 129–133. https://doi.org/10.1080/00031305.2016.1154108
Wasserstein, R. L., Schirm, A. L., & Lazar, N. A. (2019). Moving to a world beyond "p < 0.05". The American Statistician, 73(sup1), 1–19. https://doi.org/10.1080/00031305.2019.1583913
Not sure how this guide applies to your own case? Talk it through with MAAS in a free 20-minute consultation.
Book a free consultation ▸