
◆ Research Methods
What is a one-way ANOVA, and how do you report it?
A one-way ANOVA tests whether the means of three or more independent groups differ on one continuous outcome, using a single grouping factor. This guide explains when to choose it over a t-test, which assumptions to check before you trust the F value, how to read the ANOVA table that SPSS prints, and how to write the result in APA 7 style with an effect size. The worked example uses invented data so that every number can be checked against the others.

◆ Question 1 / 8 · What it is for
What is a one-way ANOVA test used for?
Direct answer: A one-way ANOVA compares the means of independent groups defined by one categorical factor, such as three teaching methods or four age bands, on one continuous outcome. Kent State University Libraries (n.d.) describe it as a test of whether there is statistical evidence that the population means of the groups differ.
The name tells you most of the method. "Analysis of variance" means the test does not compare the means directly. Cornish (2006) explains the logic plainly: "In analysis of variance we compare the variability between the groups (how far apart are the means?) to the variability within the groups (how much natural variation is there in our measurements?)" (Cornish, 2006, p. 2). The ratio of those two quantities is the F statistic. When the group means sit far apart relative to the spread inside each group, F grows and the p value falls. "One-way" means there is exactly one grouping factor. The outcome must be continuous, measured at interval or ratio level, and each participant belongs to one group only (Kent State University Libraries, n.d.).
The null hypothesis states that all population means are equal. The alternative states only that at least one mean differs, which is why a significant F is called an omnibus result: it tells you that a difference exists somewhere, but not where (Kent State University Libraries, n.d.).
◆ Question 2 / 8 · ANOVA or t-test
When should you use a one-way ANOVA instead of a t-test?
Direct answer: Use a t-test for two independent groups and a one-way ANOVA for three or more. With exactly two groups the two tests agree, because the F value equals the square of the t value, so the choice only matters once a third group enters the design.
Kent State University Libraries (n.d.) note that both tests can compare two groups, but only the ANOVA can compare three or more at once, and that with two groups you should find that t² = F. The reason not to run a series of t-tests across three groups is arithmetic. Three groups need three pairwise comparisons, and if each runs at α = .05, the chance of at least one false positive across the set rises to about 1 − .95³, roughly .14. A single omnibus F keeps the error rate for the overall question at the level you set, and you then follow it with post hoc tests that are built to control that rate across the pairs.
| Question | Test | Grouping factors | Groups |
|---|---|---|---|
| Do two independent groups differ? | Independent-samples t-test | 1 | 2 |
| Do three or more independent groups differ? | One-way ANOVA | 1 | 3 or more |
| Do two factors and their interaction affect the outcome? | Two-way ANOVA | 2 | 2 or more per factor |
| Do the same people differ across conditions? | Repeated-measures ANOVA | 1 within-subjects | 2 or more |
| Groups differ but assumptions fail badly | Kruskal-Wallis test | 1 | 3 or more |
◆ Question 3 / 8 · One-way or two-way
What is the difference between a one-way and a two-way ANOVA?
Direct answer: A one-way ANOVA has one grouping factor, while a two-way ANOVA has two factors and also tests whether they interact. If your design crosses teaching method with year of study, you need the two-way version, because a one-way model would ignore the second factor.
People sometimes ask how a one-way ANOVA differs from a "normal" ANOVA. There is no single normal version: ANOVA is a family of models, and the one-way model is its simplest member. The two-way model adds a second factor and an interaction term, which asks whether the effect of one factor depends on the level of the other. Repeated-measures designs, where the same participants appear in every condition, need yet another model because their observations are not independent, which breaks a core requirement of the one-way test (Kent State University Libraries, n.d.). Choose the model from the design you planned, not from the output you prefer. The wider decision tree, including when each of these models applies, is in our guide to choosing the right statistical test.
◆ Question 4 / 8 · Assumptions
Which assumptions must a one-way ANOVA meet?
Direct answer: The groups must be independent, the residuals should be roughly normal within each group, and the group variances should be similar. Unequal variances are the assumption that matters most, so check them first and switch to Welch's ANOVA when they differ.
Kent State University Libraries (n.d.) list requirements including a continuous dependent variable, a categorical independent variable, independent observations, an approximately normal outcome in each group, similar variances, and no outliers. The guide adds that unequal variances combined with unequal group sizes make the p value for the overall F test untrustworthy, and points to the Brown-Forsythe and Welch statistics in the SPSS Options dialog as alternatives.
The sources do not weigh the variance assumption the same way, and the difference is worth knowing. Cornish (2006) offers a rule of thumb that ANOVA remains valid if the largest standard deviation is less than twice the smallest. Delacre et al. (2019) are more cautious. They note that departures from normality generally do not strongly affect the Type I error rate, but that the "F-test is not robust against unequal variances" (Delacre et al., 2019, p. 1). After simulating realistic conditions they "recommend using the W-test by default when comparing means" (Delacre et al., 2019, p. 1), where the W-test is Welch's ANOVA. The same authors found that only one of the articles in their 2016 journal sample that reported a one-way F-test indicated the variance assumption had been taken into account. A careful student can therefore report Levene's test, state whether the variances differ, and report Welch's ANOVA where they do.
If the normality, outlier or equal-variance assumption is not met, Kent State University Libraries (n.d.) suggest the non-parametric Kruskal-Wallis test instead.
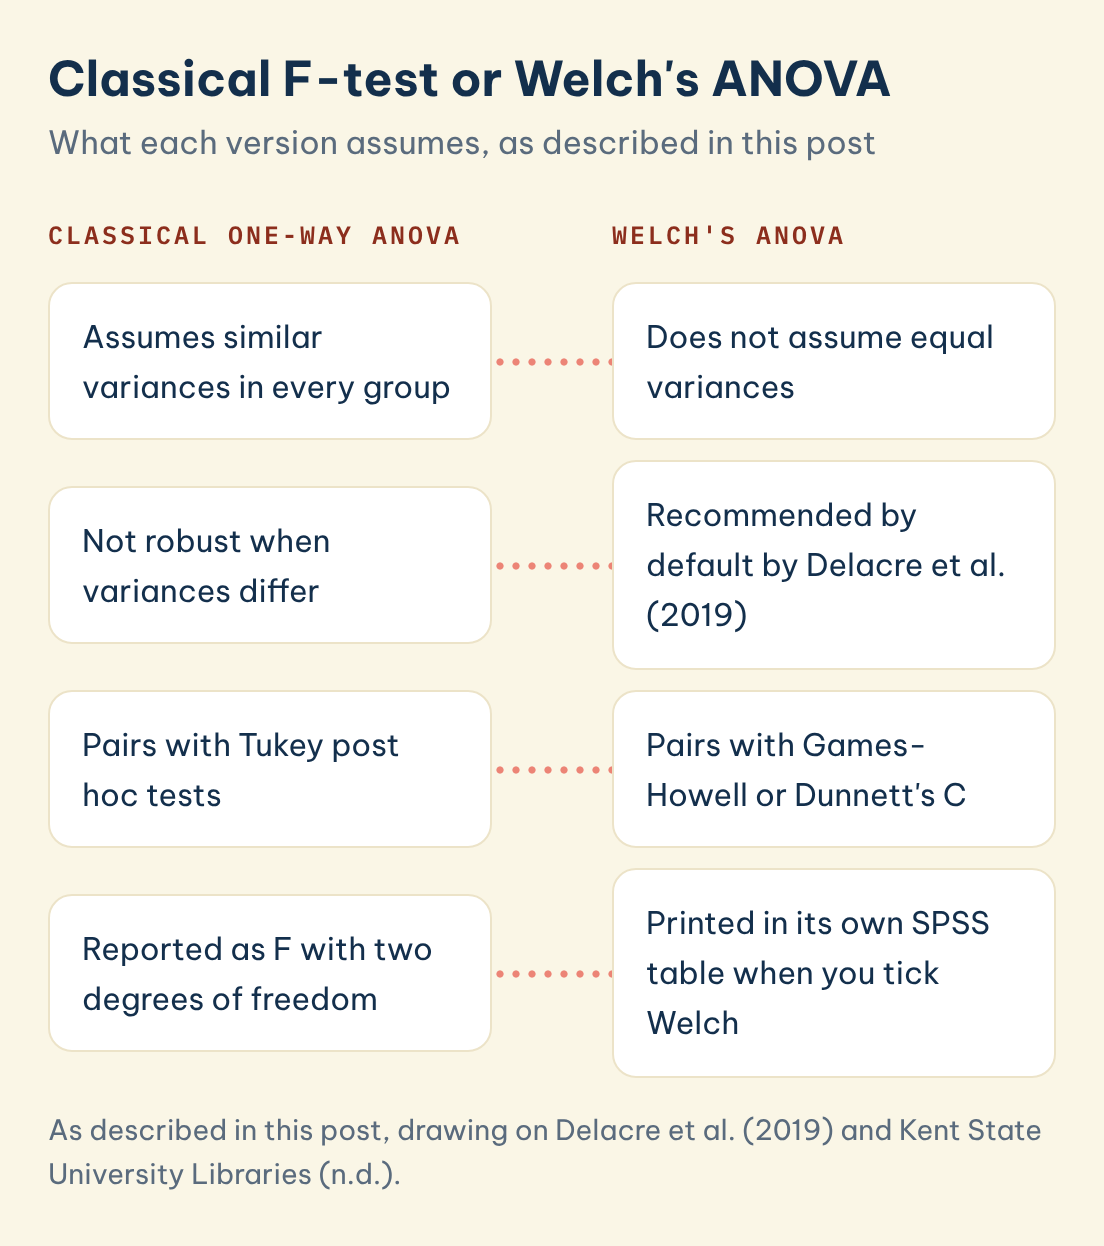
Classical F-test or Welch's ANOVA
What each version assumes, as described in this post
Classical one-way ANOVA
Welch's ANOVA
Assumes similar variances in every group
Does not assume equal variances
Not robust when variances differ
Recommended by default by Delacre et al. (2019)
Pairs with Tukey post hoc tests
Pairs with Games-Howell or Dunnett's C
Reported as F with two degrees of freedom
Printed in its own SPSS table when you tick Welch
Save this figure
◆ Question 5 / 8 · Running it in SPSS
How do you run a one-way ANOVA in SPSS?
Direct answer: Open Analyze, then Compare Means, then One-Way ANOVA, move the outcome into the Dependent List and the grouping variable into Factor, and use Options to request descriptives, the homogeneity of variance test and the Welch statistic. Use Post Hoc to choose a pairwise test.
Kent State University Libraries (n.d.) walk through this dialog step by step. Three settings are easy to miss. First, tick Descriptive in Options so the output shows the group means and standard deviations you will need for the write-up. Second, tick Homogeneity of variance test, which prints Levene's test, and Welch, which prints the robust alternative in a separate table. Third, choose a post hoc test that matches your variances: Tukey's test assumes equal variances, while Kent State University Libraries (n.d.) note that unequal variances call for post hoc tests that do not assume them, such as Dunnett's C. Games-Howell is another option in the same SPSS dialog for unequal variances.
Decide your post hoc test before you see the output. Picking the test that gives the most significant pairs after the fact is a form of selective reporting, and an examiner reading your methods chapter will look for the reason behind the choice.
◆ Question 6 / 8 · Reading the table
How do you read a one-way ANOVA table?
Direct answer: Read the Between Groups row: its F value, its two degrees of freedom (between and within) and its significance value form the result you report. The Within Groups row supplies the error term, and the Total row is the sum of the two.
Here is an invented example. A student compares exam scores across three revision methods with 20 students in each group, so N = 60.
| Source | Sum of squares | df | Mean square | F | Sig. |
|---|---|---|---|---|---|
| Between Groups | 420.40 | 2 | 210.20 | 4.21 | .020 |
| Within Groups | 2,845.95 | 57 | 49.93 | ||
| Total | 3,266.35 | 59 |
The between-groups degrees of freedom are the number of groups minus one, here 2. The within-groups degrees of freedom are the total sample minus the number of groups, here 57. Each mean square is its sum of squares divided by its degrees of freedom, and F is the between mean square divided by the within mean square, 210.20 divided by 49.93. A significance value of .020 is below α = .05, so you reject the null hypothesis that the three population means are equal. That is all the omnibus test tells you: you still need the post hoc table to see which revision methods differ.
◆ Question 7 / 8 · APA 7 reporting
How do you report a one-way ANOVA in APA 7 style?
Direct answer: Report the test, the F value with both degrees of freedom, the exact p value and an effect size, then the post hoc results with group means and standard deviations. For the example above, write F(2, 57) = 4.21, p = .020, η² = .13.
The American Psychological Association (2024) sets the formatting rules. Report inferential statistics such as F to two decimals and exact p values to two or three decimals, write p values below .001 as p < .001, and drop the leading zero for statistics that cannot exceed 1, such as p. Italicise statistical symbols written in Latin letters, such as F, p and M, but keep Greek letters such as η upright.
The effect size answers a question the p value cannot: how large the difference is. If you run the analysis through GLM Univariate, SPSS labels it partial eta squared; in a one-way design this equals eta squared (Lakens, 2013). Lakens (2013) also reports Cohen's benchmarks of η² = .01, .06 and .14 for small, medium and large effects, and notes that omega squared (ω²) is a less biased estimate. In the example, η² = .13 and ω² = .10, a medium-to-large effect. A full sentence might read:
A one-way ANOVA showed that revision method affected exam scores, F(2, 57) = 4.21, p = .020, η² = .13. Tukey post hoc tests indicated that the retrieval-practice group scored higher than the re-reading group.
Add the group means and standard deviations in the same paragraph or in a table, but not in both, because the American Psychological Association (2024) advises against repeating statistics in the text and a table. Our guide to reporting effect size and confidence intervals covers the interval estimates that many supervisors now expect alongside η².
◆ Question 8 / 8 · How MAAS helps
How can MAAS help with your ANOVA?
Direct answer: A MAAS mentor works through your own data and output with you, explains which test and post hoc procedure your design calls for, and checks that your write-up matches the numbers. You run and report the analysis yourself, with a specialist explaining each step.
MAAS's SPSS, R and Python data analysis support helps students choose a test that fits their design, check assumptions and read the output before the results chapter is written. If you are unsure whether your groups call for a standard or a Welch ANOVA, a free discovery call with MAAS, a Ho Chi Minh City company, is a conversation about your project with no obligation. You can book one here. For the step before any ANOVA, our guide to calculating sample size for a research study explains how many participants each group needs.
Frequently asked questions
What is a one-way ANOVA test used for?
You use it when one grouping variable splits your sample into three or more separate groups and you want to know whether their average scores on a single continuous measure really differ, rather than differing by chance.
When should I use a one-way ANOVA instead of a t-test?
Use it when you have three or more groups. With two groups the tests agree, because F equals t squared (Kent State University Libraries, n.d.), and running several t-tests across three groups inflates the chance of a false positive.
What does a significant F tell me?
Only that at least one group mean differs from the others. It does not say which pair, so you need post hoc tests such as Tukey or, with unequal variances, Games-Howell.
What if my group variances are unequal?
Report Welch's ANOVA. Delacre et al. (2019) found that the classical F-test is not robust against unequal variances and recommend the Welch test by default when comparing means.
Which effect size should I report for a one-way ANOVA?
Eta squared is the most common. Lakens (2013) notes that partial eta squared equals eta squared in a one-way design and that omega squared is a less biased alternative.
What is the non-parametric alternative to a one-way ANOVA?
The Kruskal-Wallis test, which Kent State University Libraries (n.d.) suggest when normality, outlier or variance assumptions are not met.
References
American Psychological Association. (2024). APA Style numbers and statistics guide. https://apastyle.apa.org/instructional-aids/numbers-statistics-guide.pdf
Cornish, R. (2006). Statistics: 1.5 Oneway analysis of variance. Mathematics Learning Support Centre, Loughborough University. https://www.statstutor.ac.uk/resources/uploaded/onewayanova.pdf
Delacre, M., Leys, C., Mora, Y. L., & Lakens, D. (2019). Taking parametric assumptions seriously: Arguments for the use of Welch's F-test instead of the classical F-test in one-way ANOVA. International Review of Social Psychology, 32(1), Article 13. https://doi.org/10.5334/irsp.198
Kent State University Libraries. (n.d.). SPSS tutorials: One-way ANOVA. https://libguides.library.kent.edu/SPSS/OneWayANOVA
Lakens, D. (2013). Calculating and reporting effect sizes to facilitate cumulative science: A practical primer for t-tests and ANOVAs. Frontiers in Psychology, 4, Article 863. https://doi.org/10.3389/fpsyg.2013.00863
Not sure how this guide applies to your own case? Talk it through with MAAS in a free 20-minute consultation.
Book a free consultation ▸