
◆ Research Methods
How does hypothesis testing work, step by step?
Hypothesis testing is a structured way to ask whether your data are compatible with a default claim, usually that there is no difference or no relationship. You state the claim, choose a threshold, calculate a test statistic and a p-value, make a decision and report it honestly.
Most students meet the procedure as a list of steps and then lose marks on the interpretation, because the p-value is one of the most misread numbers in research. This guide walks through the steps used by university statistics help pages in the UK and Australia, runs one invented example with a t-test, explains Type I and Type II errors and the symbol β, and shows the APA 7 reporting format. If you are still deciding which test to use, start with our guide on choosing the right statistical test.
◆ Question 1 / 7 · What it is
What is hypothesis testing?
Direct answer: Hypothesis testing is a procedure for judging whether sample data are unusual under a default claim, the null hypothesis. You compute a test statistic and a p-value, then decide whether to reject that claim (RMIT University Library, n.d.; University of Sheffield, n.d.). It supports a decision about evidence and does not prove anything is true.
The null hypothesis is usually a statement of no difference or no effect, and the alternative hypothesis states what you suspect instead. Wasserstein and Lazar (2016) define the p-value informally as "the probability under a specified statistical model that a statistical summary of the data (e.g., the sample mean difference between two compared groups) would be equal to or more extreme than its observed value" (p. 131). Notice that the definition describes the data under a model, not the hypothesis itself.
The statement was published in 2016 in volume 70 of The American Statistician and sets out 6 principles on how p-values should and should not be used. That distinction explains why careful sources never say a null hypothesis is accepted. The University of Sheffield (n.d.) states that by convention we never say we "accept" a hypothesis. You either reject the null or fail to reject it, and failing to reject means the data did not give enough evidence against it, which is a weaker statement than showing it is true.
◆ Question 2 / 7 · The steps
What are the steps of hypothesis testing?
Direct answer: Most university guides give five steps. State the null and alternative hypotheses, set the significance level, check the variable types and assumptions to choose a test, compare the p-value with the significance level, then link the result back to the research question (University of Southampton Library, 2026).
The University of Southampton Library page was updated in January 2026, and different pages count the steps differently, which is why searches return "5 steps" and "7 steps". RMIT University Library (n.d.) lists 4 early steps, namely hypotheses, significance level, test statistic and p-value in that order, while the University of Southampton Library (2026) adds identifying variable types, testing assumptions and returning to the research question. Mathematics and Statistics Help at the University of Sheffield adds the wording rule that you reject or fail to reject the null, never accept it (University of Sheffield, n.d.). The table below merges them into one sequence you can follow in an assignment or thesis.
| Step | What you do | What to write down |
|---|---|---|
| 1. State the hypotheses | Write the null and alternative from your research question | H0 and H1 in plain words and in symbols |
| 2. Set the significance level | Choose α before you look at the results | α, for example .05 |
| 3. Choose the test | Match the test to the variable types, design and assumptions | Test name and why it fits |
| 4. Calculate the test statistic and p-value | Run the test in your software | t, df and the exact p |
| 5. Decide | Compare p with α, then reject or fail to reject H0 | The decision in one sentence |
| 6. Report and interpret | Give the statistic, p and an effect size, and answer the research question | A results sentence in APA format |
The order matters most at step 2. Choosing α after seeing the p-value invites the temptation to pick whichever threshold produces the result you wanted, so write it down first. Our guide to reporting effect sizes and confidence intervals covers what to add at step 6.
◆ Question 3 / 7 · Worked example
What does a worked example of a hypothesis test look like?
Direct answer: Suppose, hypothetically, you compare exam scores for two teaching methods with 30 students each. Group A averages 68 and group B averages 72, both with a standard deviation of 10. An independent-samples t-test gives t(58) = 1.55 and p = .13, so at α = .05 you fail to reject the null.
All numbers in this example are invented to show the mechanics and do not come from real data: 30 students per group, means of 68 and 72, and a standard deviation of 10 in each group. Here is each step applied. The null hypothesis says the two methods have the same mean score in the population, and the alternative says the means differ. We set α at .05, and because the outcome is a score and the two groups are independent, an independent-samples t-test is a reasonable candidate once its assumptions have been checked.
The test statistic is the observed difference divided by its standard error. Here the difference is 4 points and the standard error is about 2.58, so t is about 1.55 on 58 degrees of freedom, which is 30 plus 30 minus 2. The two-tailed p-value for that statistic is roughly .13, which is larger than .05. The decision is to fail to reject the null hypothesis. The wording in your write-up should be careful: the data do not provide enough evidence of a difference between the methods, which is not the same as showing the methods are equal.
◆ Question 4 / 7 · The p-value
What does a p-value tell you, and what does it not?
Direct answer: A p-value measures how incompatible your data are with a specified model, usually the null hypothesis. The American Statistical Association states that "P-values do not measure the probability that the studied hypothesis is true, or the probability that the data were produced by random chance alone" (Wasserstein & Lazar, 2016, p. 131).
Common p-value misreadings compared with what the sources say
Four mistakes that cost marks in student write-ups
Common misreading
What the sources say
p = .03 means a 3% chance the null is true
The p-value is not a hypothesis probability
A large p-value proves there is no effect
It only suggests the data are not unusual under the model
A significant result means an important result
Very minor effects can be significant in a large study
Failing to reject means accepting the null
By convention we never say we accept a hypothesis
Save this figure
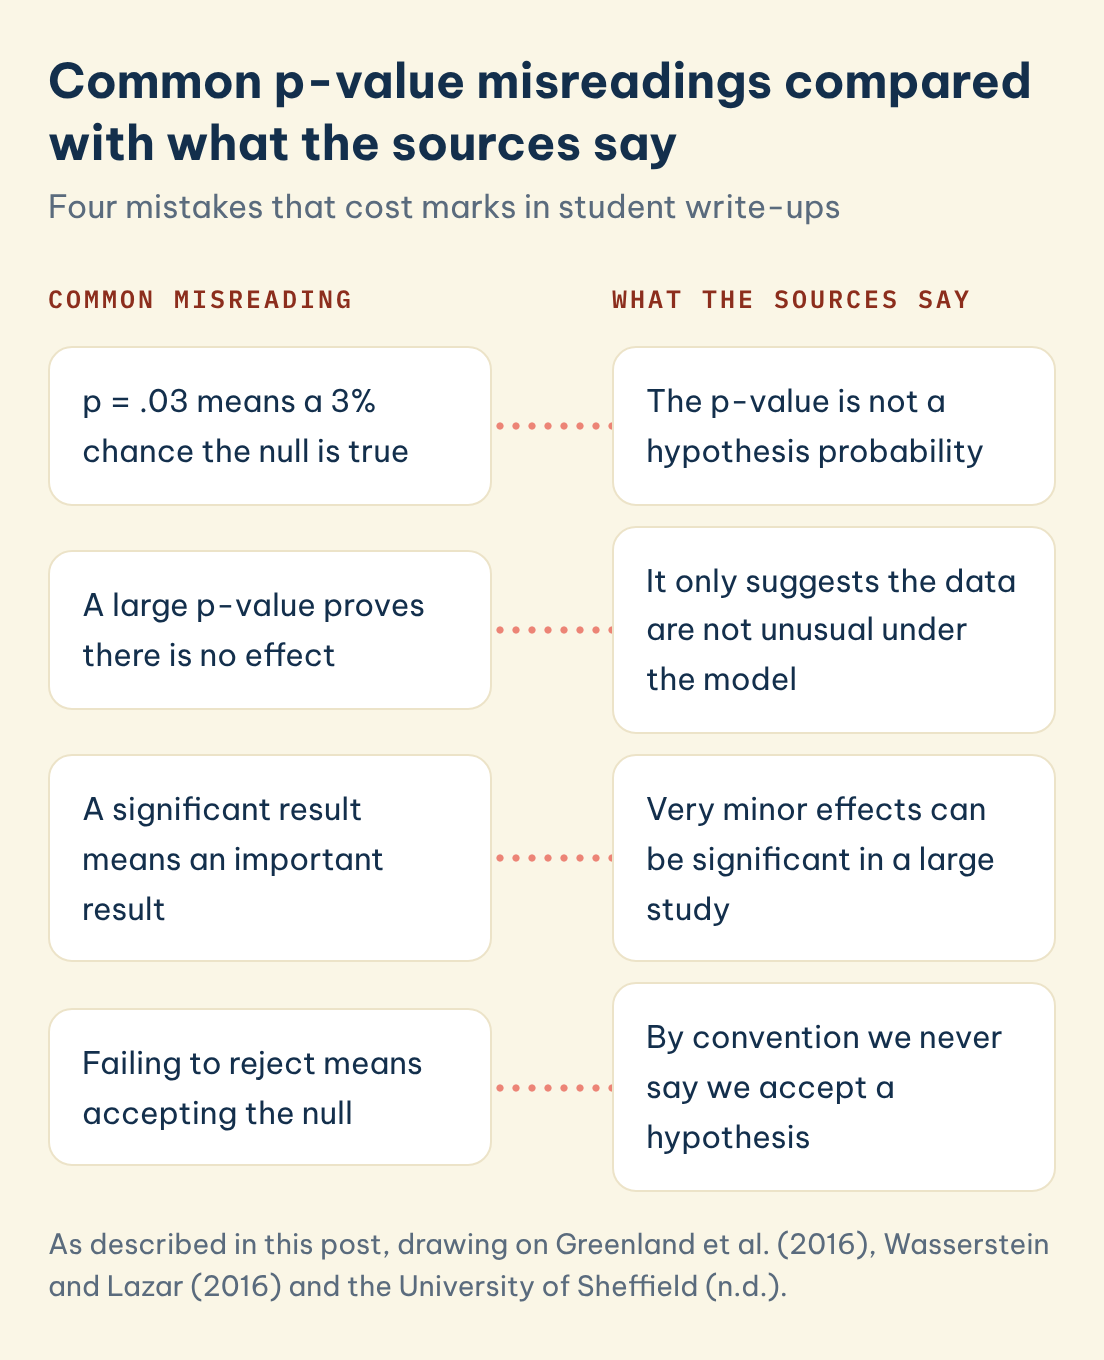
Greenland et al. (2016) catalogue 25 misinterpretations of P values, confidence intervals and power, and three of them are especially common. The first treats p = .03 as a 3% chance that the null is true. Greenland et al. (2016) list this as misinterpretation number one and answer "No!", because the p-value assumes the test hypothesis is true and is not a hypothesis probability. The second treats a large p-value as proof of no effect. Greenland et al. (2016) say a large p-value only suggests that the data are not unusual if all the assumptions used to compute it were correct.
The third misreading confuses statistical significance with importance. Greenland et al. (2016) note that, especially when a study is large, very minor effects can lead to statistically significant tests of the null hypothesis. Wasserstein et al. (2019) go further and recommend that "statistically significant" should no longer be used as a label, and that p-values should be reported as continuous quantities (p. 2). Wasserstein and Lazar (2016) add that a p-value near 0.05 taken by itself offers only weak evidence against the null hypothesis, and the 2019 editorial condenses its advice into 7 words: accept uncertainty, be thoughtful, open and modest. Many courses still require the threshold language, so use the term the way your marking criteria expect and add the exact p and an effect size.
◆ Question 5 / 7 · Type I, Type II and β
What are Type I errors, Type II errors and β?
Direct answer: A Type I error means rejecting a null hypothesis that is actually true, and α is the long-run rate of such errors you agree to tolerate. A Type II error means failing to reject a null hypothesis that is actually false. The Greek letter β denotes the probability of a Type II error, and power equals 1 minus β.
Greenland et al. (2016) define power as the pre-study probability that the test will reject the test hypothesis, for example the probability that P will not exceed a cut-off such as 0.05, and they call one minus power the Type II or beta error rate. These definitions explain why the significance level is a choice rather than a law. Lowering α makes false positives rarer but, for a fixed sample size, raises β, so real effects are easier to miss. Raising the sample size, for instance from 30 to 60 students per group in the example above, is the usual way to improve power, which is why studies with very small samples often fail to reject the null even when a real difference exists.
Do not confuse α with the chance that a significant result is wrong. Greenland et al. (2016) address this directly: the belief that rejecting at P ≤ 0.05 means a 5% chance of a false positive is another misinterpretation they answer with "No!". The error rate describes the long-run behaviour of the procedure under the null, not the probability that your particular finding is false. Power analysis belongs in the planning stage of a study, before data collection.
◆ Question 6 / 7 · APA reporting
How do you report a hypothesis test in APA style?
Direct answer: APA Style says to report exact p values to two or three decimals, to write p < .001 for very small values, and to omit the zero before the decimal when the statistic cannot exceed 1 (American Psychological Association, 2024). For the example above you would write t(58) = 1.55, p = .13.
A complete results sentence names the test, gives the statistic with its degrees of freedom, gives the exact p, and states the decision in words that answer the research question. Add an effect size and a confidence interval, as explained in our effect size and confidence interval guide, because the p-value alone does not describe how large the difference is. Wasserstein and Lazar (2016) list full reporting and transparency among their 6 principles, so state how many tests you ran and which ones. For a very small result, write p < .001 rather than p = .000, and give exact values such as p = .006 or p = .03 otherwise (American Psychological Association, 2024).
A note on conventions: APA writes p = .032 without a leading zero, while the American Statistical Association statement, the 2019 editorial by Wasserstein et al. (for example p = 0.08) and the 2016 guide by Greenland et al. write values with a leading zero. Neither is wrong, because journals differ. Follow your course's style guide and stay consistent across tables, text and figures.
◆ Question 7 / 7 · Mentor help
Can a mentor help with hypothesis testing?
Students at UK and Australian universities often understand the steps but struggle to apply them to their own data, especially when choosing between tests and checking assumptions. A mentor or analyst can walk through your design with you, explain what each number in the software output means and check that your write-up matches the output. Through the SPSS, R and Python data analysis help at MAAS, the analysis stays your work to understand and defend, and our guide on what statistics help can and cannot cover in a thesis explains where the line sits. Bring your research question, your dataset description and your supervisor's expectations to the first conversation so that the help responds to your actual assignment and not to a generic example.
Frequently asked questions
What do you mean by hypothesis testing?
Hypothesis testing is a procedure for deciding whether sample data provide enough evidence against a default claim called the null hypothesis. You calculate a test statistic and a p-value and then reject or fail to reject the null (University of Sheffield, n.d.).
What are the 5 steps of hypothesis testing?
State the null and alternative hypotheses, choose the significance level, identify the variables and choose a test, compare the p-value with the significance level, and link the result back to your research question (University of Southampton Library, 2026).
What does β mean in statistics?
β is the probability of a Type II error, which means failing to reject a null hypothesis that is false. Statistical power is 1 minus β, so a study with low power is more likely to miss a real effect.
What is an example of a hypothesis test?
A common example compares the mean scores of two independent groups with a t-test. In the hypothetical example above, t(58) = 1.55 and p = .13, so the null hypothesis of equal means is not rejected at α = .05. The mean difference is 4 points, the standard error is about 2.58, and the 58 degrees of freedom come from 30 + 30 minus 2. The exact two-tailed p is about .127, which rounds to .13, and the difference would need to be roughly 2.0 standard errors, about 5.2 points, to reach p < .05 with this design.
What is the hypothesis testing formula?
There is no single formula, because each test has its own statistic. For a two-group t-test the statistic is the difference between the sample means divided by the standard error of that difference, as in the worked example.
Can I say I accept the null hypothesis?
No. The University of Sheffield (n.d.) states that by convention we never say we accept a hypothesis, so write that you failed to reject the null. A large p-value does not show the null is true (Greenland et al., 2016).
References
American Psychological Association. (2024). Number and statistics guide, APA Style 7th edition [Instructional aid]. https://apastyle.apa.org/instructional-aids/numbers-statistics-guide.pdf
Greenland, S., Senn, S. J., Rothman, K. J., Carlin, J. B., Poole, C., Goodman, S. N., & Altman, D. G. (2016). Statistical tests, P values, confidence intervals, and power: A guide to misinterpretations. European Journal of Epidemiology, 31(4), 337–350. https://doi.org/10.1007/s10654-016-0149-3
RMIT University Library. (n.d.). P-values. RMIT Learning Lab. https://learninglab.rmit.edu.au/maths-statistics/statistics/s16-p-value/
University of Sheffield. (n.d.). Introduction to hypothesis tests. Mathematics and Statistics Help. https://sheffield.ac.uk/mash/stats-resources/hypothesis
University of Southampton Library. (2026). Maths and stats: Hypothesis testing. https://library.soton.ac.uk/hypothesis-testing
Wasserstein, R. L., & Lazar, N. A. (2016). The ASA statement on p-values: Context, process, and purpose. The American Statistician, 70(2), 129–133. https://doi.org/10.1080/00031305.2016.1154108
Wasserstein, R. L., Schirm, A. L., & Lazar, N. A. (2019). Moving to a world beyond "p < 0.05". The American Statistician, 73(sup1), 1–19. https://doi.org/10.1080/00031305.2019.1583913
Tools & resources
Not sure how this guide applies to your own case? Talk it through with MAAS in a free 20-minute consultation.
Book a free consultation ▸