
◆ Communication & PR
COMM3000: why is the effect you cited six times too big?
The hardest sentence to write in this course is the one that estimates what your intervention will actually do. Students reach for a published effect size because it looks defensible, and that instinct causes the most common failure in the report. The effects reported in academic papers and the effects observed when the same intervention runs at scale are not the same size, a gap DellaVigna and Linos measured by comparing published trials against real behavioural science units.
Note on the code: this guide describes the UNSW Sydney course. COMM3000 codes also exist at several North American universities with entirely different content, so check the course title on your own enrolment before reading further.

◆ Question 1 / 8 · The course
How is the course built?
Direct answer: COMM3000 Evidence-based Intervention Design and Evaluation is a 6 units-of-credit undergraduate course in the UNSW Business School, taught by the School of Economics in Term 3 at the Kensington campus. It is a problem-based learning (PBL) course where you work as a management consultant, addressing one of three problem types: designing an intervention, managing its risk, or evaluating its effectiveness.
Evidence: The 2025 Term 3 course outline lists three assessment items: an individual presentation at 35%, a group project at 40%, and individual problem sets at 25%. The outline also describes the course as a synthesis course, meaning you are expected to apply and integrate knowledge from across your whole degree rather than to demonstrate one new technique. That framing matters for how you are marked. In a synthesis course the marker is not checking whether you learned the content of this course; they are checking whether you can select the right tool from three years of study and justify the selection.
Example: A student who had done well in Econometrics wrote a technically clean OLS regression and scored in the middle band, well below the top band the group project can reach. The method was not the problem. He had never explained why that method suited this client's decision, so the work read as a demonstration of skill rather than as advice.
Weightings and task types are revised between offerings, so treat the figures above as the shape of the assessment rather than as your own numbers, and confirm against the outline published for your term. If you have already taken COMM1190 or COMM2501, the data-handling habits from those courses carry over directly into the individual problem sets here.
◆ Question 2 / 8 · Evidence-based
What does "evidence-based" actually demand?
Direct answer: A comparison. Evidence that an intervention worked requires some account of what would have happened without it, and a before-and-after measurement on its own does not supply that, as Barnett, van der Pols and Dobson (2005) demonstrate.
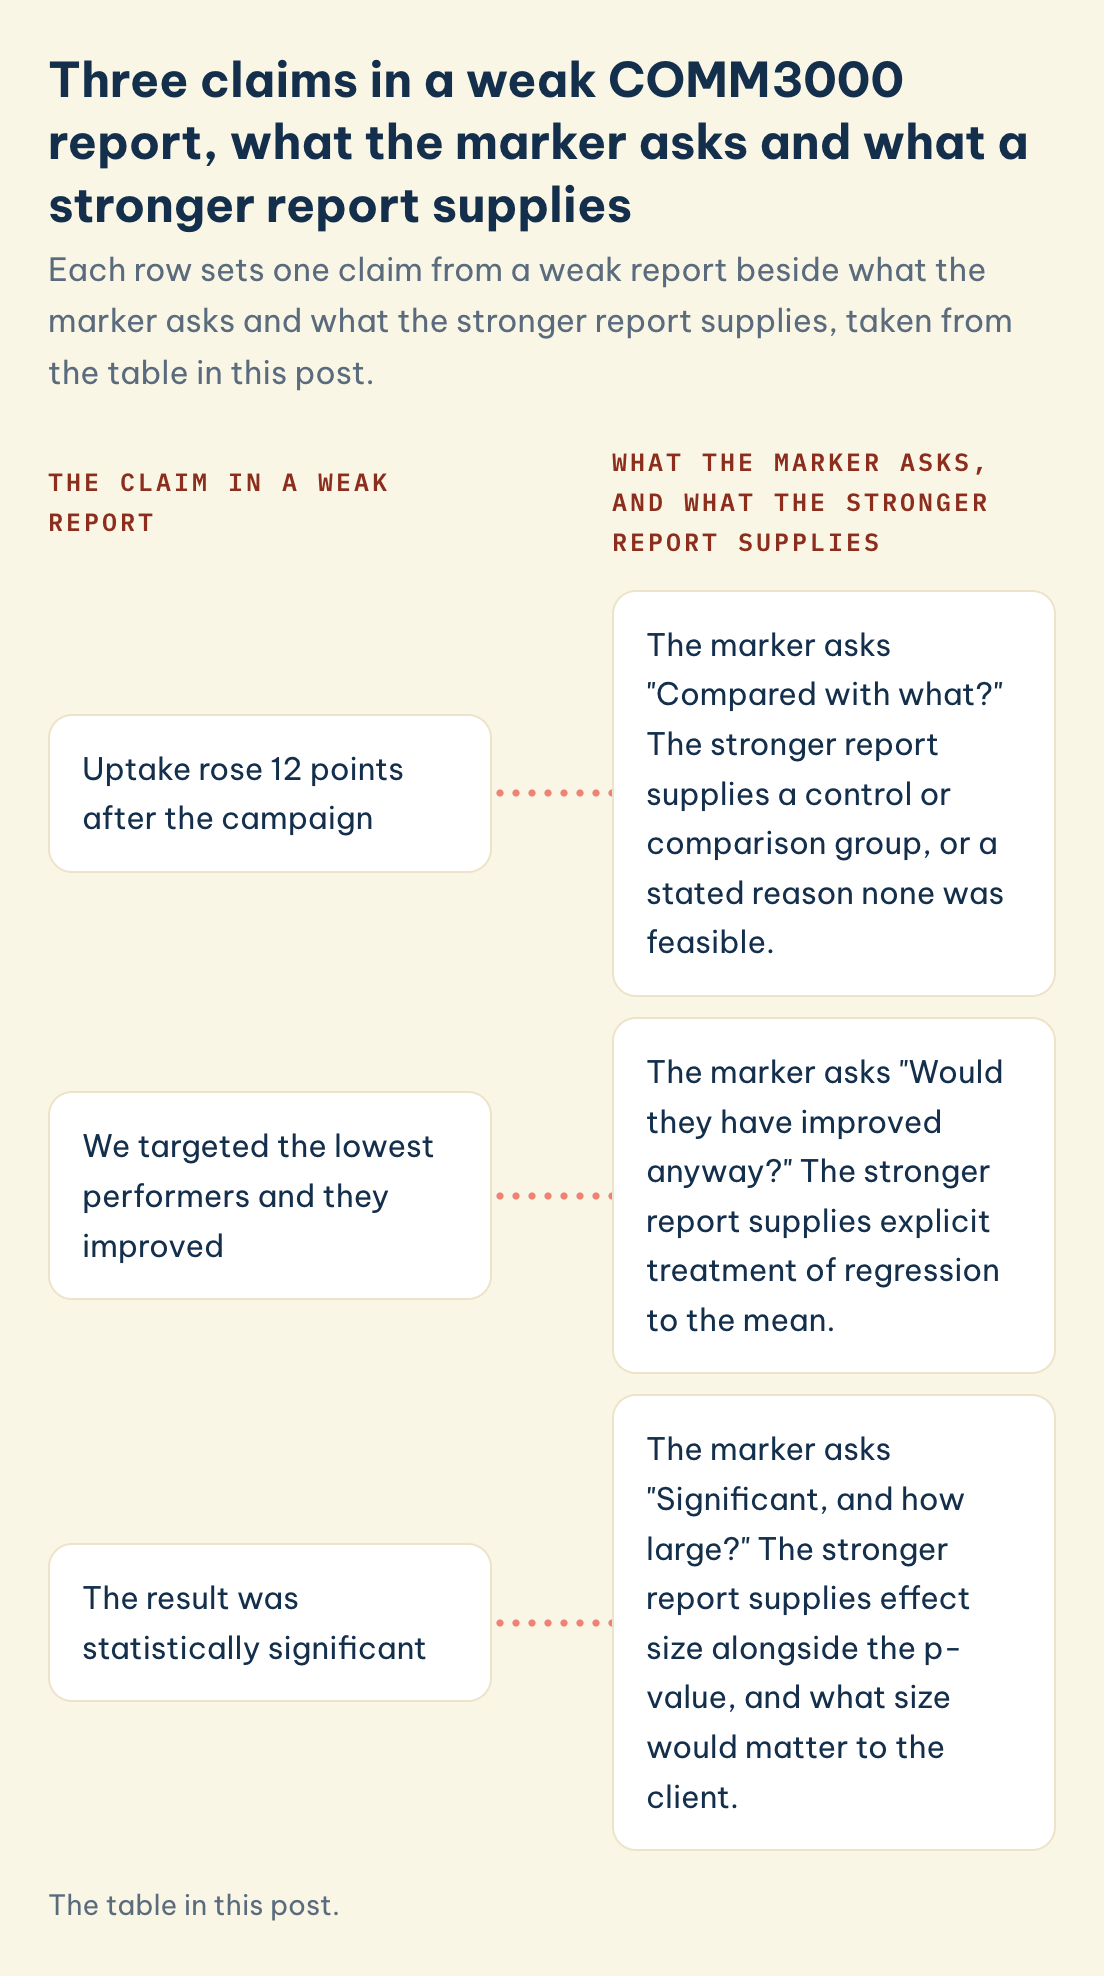
Three claims in a weak COMM3000 report, what the marker asks and what a stronger report supplies
Each row sets one claim from a weak report beside what the marker asks and what the stronger report supplies, taken from the table in this post.
The claim in a weak report
What the marker asks, and what the stronger report supplies
Uptake rose 12 points after the campaign
The marker asks "Compared with what?" The stronger report supplies a control or comparison group, or a stated reason none was feasible.
We targeted the lowest performers and they improved
The marker asks "Would they have improved anyway?" The stronger report supplies explicit treatment of regression to the mean.
The result was statistically significant
The marker asks "Significant, and how large?" The stronger report supplies effect size alongside the p-value, and what size would matter to the client.
Save this figure
Evidence: The problem is not only that other things change over time. It is that the way programmes select their participants builds a false result into the data. Barnett, van der Pols and Dobson (2005), writing in the International Journal of Epidemiology, set out the mechanism: when unusually high or low measurements are followed by measurements closer to the average, natural variation looks like real change. Interventions are routinely targeted at exactly the cases that were unusually bad at the moment of measurement, which is the condition under which this effect is largest. A programme aimed at the worst-performing branches, the least engaged customers, or the lowest-scoring students will show improvement whether or not it did anything, and a report that presents that improvement as its result has measured the selection rule rather than the intervention.
| The claim in a weak report | What the marker asks | What the stronger report supplies |
|---|---|---|
| Uptake rose 12 points after the campaign | Compared with what? | A control or comparison group, or a stated reason none was feasible |
| We targeted the lowest performers and they improved | Would they have improved anyway? | Explicit treatment of regression to the mean |
| The result was statistically significant | Significant, and how large? | Effect size alongside the p-value, and what size would matter to the client |
Example: A team evaluated a reminder sent to customers who had missed a payment. Repayment rose sharply. The number did not survive the question of what the same customers would have done unprompted, since missing one payment is exactly the kind of unusual month that Barnett, van der Pols and Dobson (2005) describe as tending to be followed by a normal one. Adding a comparison group of similar customers who received nothing turned an unusable figure into a finding.
◆ Question 3 / 8 · Effect size
Why is the effect you cited six times too big?
Direct answer: Because the published literature is a filtered sample. Studies with large effects are more likely to be written up and accepted, and interventions run inside real organisations face frictions that a trial designed by researchers does not.
Evidence: DellaVigna and Linos (2022), publishing in Econometrica, assembled every trial run by two of the largest behavioural units in the United States, 126 randomised controlled trials covering 23 million people, and compared them with the published academic literature. In academic papers the average effect was 8.7 percentage points on take-up, a 33.4% increase over the control condition. In the units running interventions at scale the average effect was 1.4 percentage points, an increase of 8.0%. Both are real. They are not interchangeable, and quoting the first while proposing the second overstates your case by roughly a factor of six.
This gap between the published effect and the scaled effect is the single most useful piece of evidence you can bring to a report in this course, and it cuts both ways. It disciplines your forecast, and it also protects a modest projected effect from looking like a weak recommendation. An intervention delivering 1.4 points at negligible cost is not a disappointment; it is what the scaled evidence says a good one looks like.
Example: A group projected a 30% improvement by citing a well-known trial. Asked what would happen if the effect came in at a fifth of that, they had no answer, because the whole business case rested on the headline figure. Rebuilding the case around the scaled estimate produced a smaller claim that survived questioning, which is the outcome the course is testing.
◆ Question 4 / 8 · Designing
How do you design an intervention rather than pick one?
Direct answer: By starting from a diagnosis of why the behaviour is not happening, not from a list of tactics, using a framework such as Michie, van Stralen and West's (2011) COM-B model. Most weak proposals in this course choose the intervention first and construct the reasoning afterwards.
Evidence: Michie, van Stralen and West (2011), publishing their framework in Implementation Science, built it around exactly this problem, arguing that interventions are too often chosen by familiarity rather than by analysis. "Interventions are commonly designed without evidence of having gone through this kind of process, with no formal analysis of either the target behaviour or the theoretically predicted mechanisms of action" (Michie et al., 2011). Their COM-B system holds that a behaviour requires Capability, Opportunity and Motivation, and the practical value for your report is that the three point to different remedies. If people cannot do the thing, information will not help. If they can and want to but the environment blocks them, persuasion is wasted. Naming which of the three is binding is the diagnostic step that turns a proposal into an argument, and it is the step most often skipped.
Example: A team proposed an education campaign to raise enrolment in a workplace scheme. Their own interview data showed staff already understood the scheme and wanted it, but the sign-up form required a document most did not have to hand. The binding constraint was opportunity, not capability or motivation, the exact distinction Michie, van Stralen and West (2011) built COM-B around, so the education campaign would have spent the budget on the one thing that was not broken. The finding was already in their data; what was missing was the framework that made them look at it.
◆ Question 5 / 8 · Efficiency
Where does efficiency come into the recommendation?
Direct answer: In the ratio, not in the total. The course description names effectiveness and efficiency separately, and a recommendation that reports only the effect, without the Benartzi et al. (2017) cost lens, has answered half the question.
Evidence: Benartzi et al. (2017), writing in Psychological Science, calculated impact-per-dollar ratios for behavioural interventions and compared them against traditional policy instruments such as tax incentives and financial inducements, and found the behavioural options often compared favourably. The comparison is what matters for your report. A large effect achieved expensively can be the worse option, and a small effect achieved almost for free can be the better one, which is why the effect size alone cannot carry a recommendation. The authors are careful that more calculations are needed before the comparison generalises, and that caution is worth reproducing rather than dropping when you cite them.
Example: Two options were put to a client. The first raised participation by 9% through a subsidy. The second raised it by 3% by changing a default, the kind of low-cost nudge Thaler and Sunstein (2008) popularised in Nudge, and in line with the impact-per-dollar logic in Benartzi et al. (2017). The second was recommended and accepted, because the report showed cost per additional participant rather than participation alone.
◆ Question 6 / 8 · Presentation
What does the individual presentation test that the group project cannot?
Direct answer: Whether the reasoning is yours. A group report worth 40% can be strong while a member of the group cannot reconstruct why the analysis went the way it did, and at 35% the individual component is where that shows.
Evidence: The course outline describes the presentation as thoughtful examination and assessment that goes beyond summarising content, drawing on both reflection and critical thinking, and maps it to five UNSW Business School programme outcomes including business knowledge, problem solving and communication. In practice this means the questions afterwards are the assessment. A presenter who divided the work efficiently and owns only their section can present fluently and then stall on the first question about a choice someone else made.
Example: A student who had handled the data cleaning in SPSS presented the team's recommendation clearly and was asked why the comparison group had been defined the way it was. She had not made that decision and could not defend it, which pulled her individual mark well below the 35% the presentation carries. The fix is unglamorous and cheap: before the presentation, have each member explain one decision they did not personally make.
◆ Question 7 / 8 · International students
Where do international students most often lose marks?
Direct answer: In the consultant register, which sits between two habits that many students bring with them. One is deference, where the recommendation is softened until it stops being a recommendation. The other is the descriptive report, where the analysis is presented thoroughly and the reader is left to draw the conclusion.
Evidence: The role the course assigns is advisor, and an advisor is assessed by the UNSW Business School on the quality of a stated recommendation under uncertainty. Writing "the organisation may wish to consider several options" avoids being wrong by declining to say anything, and markers read it accordingly. The stronger move is to recommend one course of action, state the condition under which you would change your mind, and name what you would measure to find out. That is more cautious than hedging, because it exposes the reasoning rather than hiding it.
Example: A report ended with three options and no ranking. Adding two sentences, one naming the preferred option and one naming the evidence from the DellaVigna and Linos (2022) benchmark that would overturn it, moved the recommendation section a full band. Nothing in the analysis changed.
◆ Question 8 / 8 · MAAS mentors
What do MAAS mentors actually do on a course like this?
On a course assessed by consulting output, the useful help arrives before the analysis is finalised rather than after. That means checking that your evaluation design can actually detect the effect you claim, before you collect anything, using the same regression-to-the-mean logic Barnett and colleagues (2005) set out; pressure-testing your projected effect against the DellaVigna and Linos (2022) scaled benchmark, so the business case survives the first hard question; and rehearsing the questions that follow the individual presentation, which carries 35% of the final grade and is where an individual mark is won or lost. The analysis is yours and so is the report. What a mentor adds is the awkward question, asked while there is still time to act on the answer.
If you want someone to stress-test an evaluation design before your team commits to it, send us the brief and the data you have so far.
Frequently asked questions
Do I need Econometrics before taking COMM3000?
The course is described as a synthesis course drawing on skills built across your degree, and quantitative analysis, the kind covered in a typical Econometrics or Business Statistics sequence, is central to it. Check the conditions for enrolment in the UNSW Handbook entry for your own year, since these are revised between offerings.
Is COMM3000 offered outside Term 3?
The UNSW class timetable lists Term 3 delivery in person at the Kensington campus. Availability can change between years, so confirm against the current timetable before planning your enrolment sequence.
What if a randomised controlled trial (RCT) is impossible for my client's problem?
Then say so and explain what you did instead. Naming the limits of your design and reasoning about what those limits do to your conclusion demonstrates the evaluation outcome far better than presenting a weak design as though it were a strong one. This is the same discipline DellaVigna and Linos (2022) apply when comparing a controlled trial against a rougher, real-world estimate: name the design, then name what it cannot tell you.
How much does the group project mark depend on my individual contribution?
The group project carries 40%, and the two individual items, the presentation at 35% and the problem sets at 25%, together add up to 60%, carrying more weight than the group project does. Practically, this means a strong group cannot carry you and a weak group cannot sink you, but neither can you rely on your section alone at the presentation.
Can I recommend doing nothing?
Yes, if the evidence supports it and you show the reasoning. A recommendation not to intervene, backed by a cost comparison in the spirit of Benartzi et al. (2017) and a clear statement of what would change your mind, is a legitimate consulting output and is treated as one. Running the diagnostic step from Michie, van Stralen and West (2011) first often shows that no version of the intervention would clear the binding constraint, which is itself a finding worth reporting.
Related reading
References
Barnett, A. G., van der Pols, J. C., & Dobson, A. J. (2005). Regression to the mean: What it is and how to deal with it. International Journal of Epidemiology, 34(1), 215–220. https://doi.org/10.1093/ije/dyh299
Benartzi, S., Beshears, J., Milkman, K. L., Sunstein, C. R., Thaler, R. H., Shankar, M., Tucker-Ray, W., Congdon, W. J., & Galing, S. (2017). Should governments invest more in nudging? Psychological Science, 28(8), 1041–1055. https://doi.org/10.1177/0956797617702501
DellaVigna, S., & Linos, E. (2022). RCTs to scale: Comprehensive evidence from two nudge units. Econometrica, 90(1), 81–116. https://doi.org/10.3982/ECTA18709
Michie, S., van Stralen, M. M., & West, R. (2011). The behaviour change wheel: A new method for characterising and designing behaviour change interventions. Implementation Science, 6, 42. https://doi.org/10.1186/1748-5908-6-42
Thaler, R. H., & Sunstein, C. R. (2008). Nudge: Improving decisions about health, wealth, and happiness. Yale University Press.
Tools & resources
A free 20-minute consultation is a conversation about where you are with COMM3000.
Book a free consultation ▸