
◆ Research Methods
What is binary logistic regression and how do you read odds ratios?
Binary logistic regression predicts a yes-or-no outcome, such as pass or fail, from one or more predictors, and it reports each predictor's effect as an odds ratio. Sperandei (2014) describes the procedure as quite similar to multiple linear regression, except that the response variable is binomial.
Most students meet the method in a dissertation or thesis, run it in SPSS, and then stall at the output table. This guide explains what the model does, how to read an odds ratio and its confidence interval, how to describe the result in plain words, and which sample size claims deserve caution. For the step before this one, see our guide on choosing the right statistical test.
◆ Question 1 / 9 · What is meant by logistic
What is meant by logistic regression?
Direct answer: Logistic regression is a statistical model for an outcome with two categories, such as survived or died. Instead of predicting a score, it estimates how each predictor changes the odds of the outcome. Binary logistic regression is the version with exactly two outcome categories (Sperandei, 2014).
Castro and Ferreira (2022) give a short rule for choosing between the two common regression models: linear regression is used for continuous outcome variables such as days of hospitalisation, and logistic regression is used for categorical outcome variables such as death. If your dependent variable is a measured quantity, you need a different model from the one in this guide.
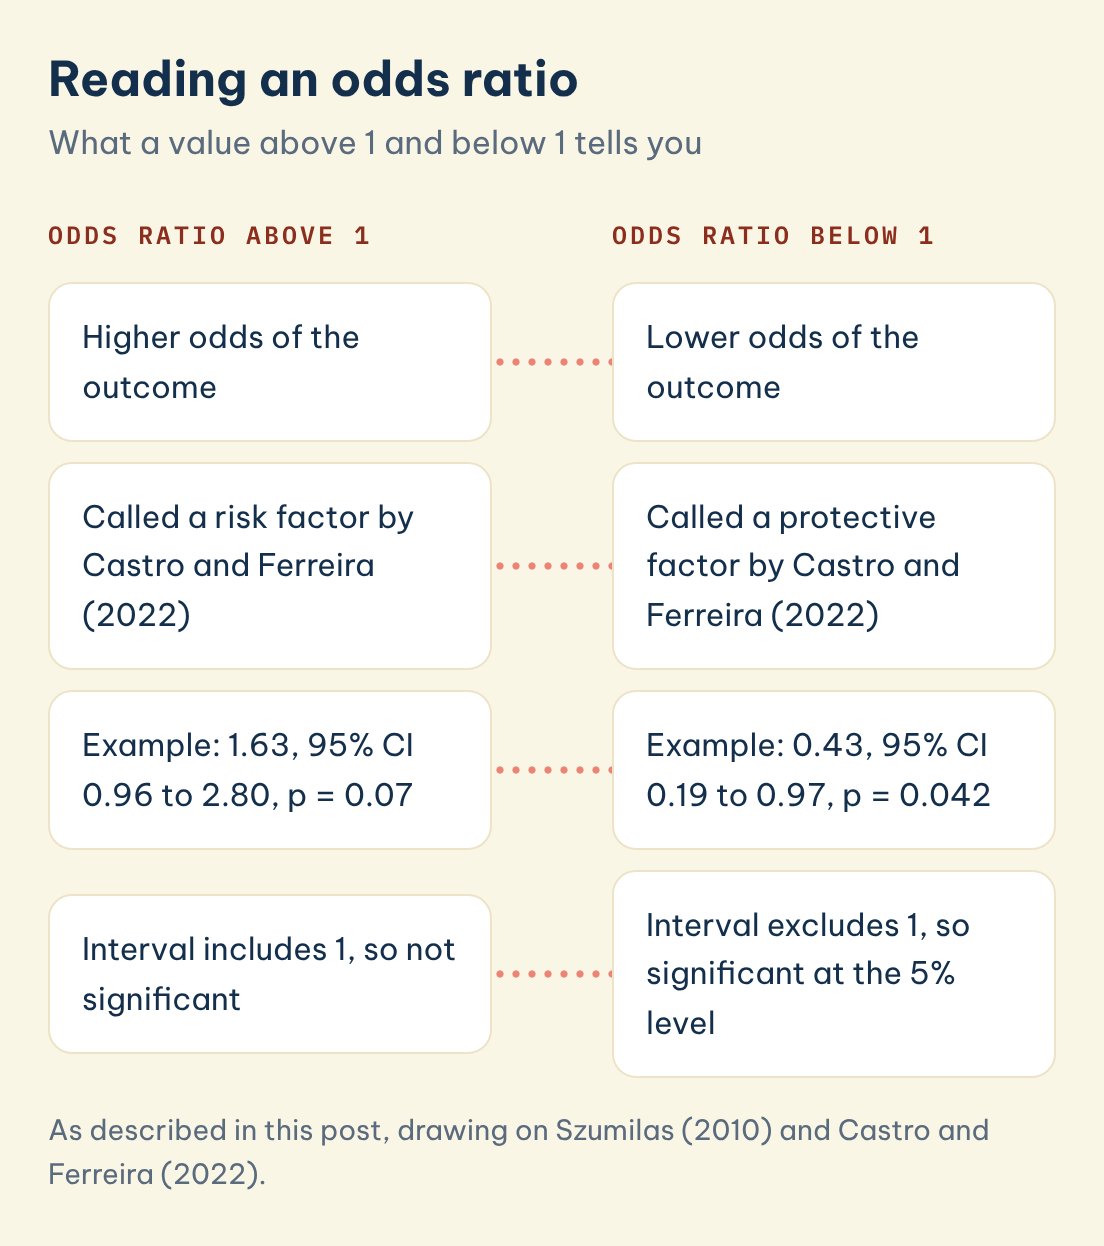
Reading an odds ratio
What a value above 1 and below 1 tells you
Odds ratio above 1
Odds ratio below 1
Higher odds of the outcome
Lower odds of the outcome
Called a risk factor by Castro and Ferreira (2022)
Called a protective factor by Castro and Ferreira (2022)
Example: 1.63, 95% CI 0.96 to 2.80, p = 0.07
Example: 0.43, 95% CI 0.19 to 0.97, p = 0.042
Interval includes 1, so not significant
Interval excludes 1, so significant at the 5% level
Save this figure
◆ Question 2 / 9 · What is the difference
What is the difference between logistic and linear regression?
Direct answer: Linear regression models a continuous outcome directly, while logistic regression models a categorical outcome through the logarithm of the odds. The two procedures are similar in layout, with several predictors and one coefficient each, but the logistic result is read as an effect on odds, not on a score (Sperandei, 2014).
The quotation below explains why the coefficients look different from a linear model: "A logistic regression will model the chance of an outcome based on individual characteristics. Because chance is a ratio, what will be actually modeled is the logarithm of the chance" (Sperandei, 2014, p. 14). Sperandei uses "chance" where most textbooks say odds, so read the two words as the same thing.
◆ Question 3 / 9 · Can you explain logistic
Can you explain logistic regression in a simple way?
Direct answer: Think of odds as a ratio of two chances: how often the event happens against how often it does not. The model finds how each predictor multiplies those odds. A multiplier above 1 raises the odds of the event, a multiplier below 1 lowers them, and exactly 1 means no association.
Szumilas (2010) defines an odds ratio as a measure of association between an exposure and an outcome. Her reading guide is the one most students need: an odds ratio of 1 means the exposure does not affect the odds of the outcome, above 1 means higher odds, and below 1 means lower odds. Castro and Ferreira (2022) use the same three-way reading and call values above 1 a risk factor and values below 1 a protective factor.
◆ Question 4 / 9 · What is the logistic
What is the logistic regression formula?
Direct answer: The model sets the log of the odds equal to a linear combination of predictors: ln(p / (1 - p)) = b0 + b1x1 + b2x2 and so on, where p is the probability of the event. Exponentiating a coefficient, written exp(B) or Exp(B) in SPSS, gives the odds ratio (Sperandei, 2014).
Each part has a plain-language meaning. The left side is the log of the odds of the outcome. The constant b0 is the log odds when every predictor sits at zero, or at its reference category. Each other coefficient b shows the change in the log odds for the matching predictor, and exp(b) converts that change into the multiplier on the odds that you report.
◆ Question 5 / 9 · How do you read an odds
How do you read an odds ratio and its confidence interval?
Direct answer: Read the odds ratio as a multiplier on the odds of the event, then check the 95% confidence interval. If the interval contains 1, the association is not statistically significant. Szumilas (2010) shows a ratio of 1.63 with a 95% interval of 0.96 to 2.80, which spans 1 and has p = 0.07.
Her example compares persistent suicidal behaviour with baseline depression, using a table with cells of 45, 86, 32 and 100. The point estimate suggests higher odds, but the interval is wide enough to include no association, so the honest conclusion (p = 0.07) is that the data do not show a clear effect. Castro and Ferreira (2022) report the opposite situation: an odds ratio of 0.43 with a 95% interval of 0.19 to 0.97 and p = 0.042, which they read as odds of documenting a pain assessment being cut by more than half.
| Exp(B) | 95% CI | How to read it | Source |
|---|---|---|---|
| 1.63 | 0.96 to 2.80 | Higher odds in the sample, but the interval includes 1, so not significant | Szumilas (2010) |
| 0.43 | 0.19 to 0.97 | Lower odds, interval excludes 1, so significant at the 5% level | Castro & Ferreira (2022) |
| 1.58 | not reported | Younger patients had 1.58 times the odds of older patients (reference: older, new treatment) | Sperandei (2014, p. 14), fictional data |
| 1 | any | No association with the outcome | Szumilas (2010) |
A continuous predictor works differently from a group comparison. Sperandei (2014) states that the exp(B) of a continuous variable represents the increment of the chance of an event for each unit increment of the explanatory variable, and Castro and Ferreira (2022) word it the same way. If age is measured in years, the odds ratio is per extra year, so say the unit in your write-up.
◆ Question 6 / 9 · Logistic regression example
Logistic regression example: how do you report a result?
Direct answer: State the outcome, the predictor, the reference group, the odds ratio, the 95% confidence interval and the p value in one sentence, then say what it means in plain words. A worked example from Sperandei (2014) uses fictional data, where exp(0.454) = 1.58 for younger compared with older patients.
In Sperandei's fictional worked example, individuals who received the new treatment but were younger had a mean chance of death of exp(0.454) = 1.58 times that of the reference individuals, and the intercept was exp(-2.121) = 0.12 (Sperandei, 2014, p. 14). The same article calculates a crude odds ratio from a two-by-two table as (152 x 103) / (17 x 248) = 3.71; the printed formula in the article swaps one cell, so check the arithmetic against its Table 1. Because the figures are invented for teaching, copy the structure of the sentences and never the numbers.
A reporting sentence for your own work might read: "Students who attended tutorials had 1.9 times the odds of passing (OR = 1.9, 95% CI 1.2 to 3.0, p = .01), compared with students who did not." The numbers there are placeholders for illustration only. Replace each part with your own output, and keep the reference category stated.
◆ Question 7 / 9 · How do you run and read it
How do you run and read it in SPSS?
Direct answer: In SPSS you run binary logistic regression from the regression menu and choose options for the confidence interval of exp(B) and the Hosmer-Lemeshow goodness-of-fit test. IBM (n.d.) documents both, plus a classification cutoff that can be set between 0.01 and 0.99.
IBM (n.d.) lists the Hosmer-Lemeshow goodness-of-fit statistic among the options for binary logistic regression. The same page says cases with predicted values above the classification cutoff are classified as positive, and the default cutoff can be changed to any value between 0.01 and 0.99. Table names and labels differ between SPSS versions, so check your own output rather than a screenshot from a book. If you want a tutor to sit alongside while you learn the menus, SPSS and Python data analysis support at MAAS is built around you running the analysis and a mentor explaining each step. See also our guide on what statistics help a thesis student can get.
◆ Question 8 / 9 · How many cases do you need
How many cases do you need?
Direct answer: The best-known rule asks for at least 10 events per variable, and it comes from a simulation study by Peduzzi et al. (1996). Later work challenges it: van Smeden et al. (2016) call the evidence supporting such rules weak and say problems at low ratios depend on other factors such as total sample size.
Peduzzi et al. (1996) used a Monte Carlo design with 673 patients, 252 deaths and 7 predictors. They found no major problems at 10 or more events per variable, while below 10 the coefficients were biased in both directions. Treat that as a classic reference point rather than a guarantee. Sperandei (2014) offers a looser rule of thumb of at least ten individuals per variable, which counts people, not events, so it is not the same rule.
For a dissertation, count the number in the smaller outcome group, not the total sample, and discuss the limitation openly if the number is small. Ask your supervisor which sample size argument your department expects.
◆ Question 9 / 9 · Can a mentor help
Can a mentor help with logistic regression?
A mentor can help you see why the model fits your question, what each line of output means and how to word the result in your methods and results chapters. Through thesis and dissertation mentoring at MAAS, the student runs the analysis and writes the chapters, and the mentor guides and reviews the work. There is no promise about marks, because your supervisor and your institution decide those.
Frequently asked questions
What does an odds ratio of 1 mean?
An odds ratio of 1 means the exposure does not affect the odds of the outcome (Szumilas, 2010). A confidence interval that includes 1 means the association is not statistically significant.
Is an odds ratio the same as a probability?
No. An odds ratio compares odds between groups, and odds are a ratio of the chance of the event to the chance of no event (Sperandei, 2014). Report it as a multiplier on the odds.
When should I use logistic instead of linear regression?
Use logistic regression for a categorical outcome such as death, and linear regression for a continuous outcome such as days of hospitalisation (Castro & Ferreira, 2022).
How do I interpret a continuous predictor?
The odds ratio is the change in the odds of the outcome for every one-unit increase in the predictor (Castro & Ferreira, 2022). State the unit, such as per year of age.
Is the 10 events per variable rule reliable?
It is a classic starting point from Peduzzi et al. (1996), but van Smeden et al. (2016) found the supporting evidence weak. Treat it as a rough guide and discuss your own sample size.
Does SPSS report the Hosmer-Lemeshow test?
IBM (n.d.) lists the Hosmer-Lemeshow goodness-of-fit statistic as an option in the logistic regression dialog, based on deciles of risk.
References
Castro, H. M., & Ferreira, J. C. (2022). Linear and logistic regression models: When to use and how to interpret them? Jornal Brasileiro de Pneumologia, 48(6), Article e20220439. https://doi.org/10.36416/1806-3756/e20220439
IBM. (n.d.). Logistic regression options. IBM SPSS Statistics documentation. https://www.ibm.com/docs/en/spss-statistics/30.0.0?topic=regression-logistic-options
Peduzzi, P., Concato, J., Kemper, E., Holford, T. R., & Feinstein, A. R. (1996). A simulation study of the number of events per variable in logistic regression analysis. Journal of Clinical Epidemiology, 49(12), 1373-1379. https://doi.org/10.1016/S0895-4356(96)00236-3
Sperandei, S. (2014). Understanding logistic regression analysis. Biochemia Medica, 24(1), 12-18. https://doi.org/10.11613/BM.2014.003
Szumilas, M. (2010). Explaining odds ratios. Journal of the Canadian Academy of Child and Adolescent Psychiatry, 19(3), 227-229. https://pmc.ncbi.nlm.nih.gov/articles/PMC2938757/
van Smeden, M., de Groot, J. A. H., Moons, K. G. M., Collins, G. S., Altman, D. G., Eijkemans, M. J. C., & Reitsma, J. B. (2016). No rationale for 1 variable per 10 events criterion for binary logistic regression analysis. BMC Medical Research Methodology, 16, Article 163. https://doi.org/10.1186/s12874-016-0267-3
Not sure how this guide applies to your own case? Talk it through with MAAS in a free 20-minute consultation.
Book a free consultation ▸