
◆ Research Methods
What is Cox regression, and how do you use it in health science?
Cox regression, published by Cox in 1972, is a regression model for time-to-event data, such as the time from diagnosis to relapse or from surgery to death. It lets you ask how several predictors, taken together, change the risk of the event at any moment, and it copes with patients who have not had the event by the time the study ends.
That ability is why it appears so often in health science dissertations. A student who tracks patients over months or years rarely observes the event in everyone, and ordinary regression cannot handle that gap. This guide covers what a Cox model tells you, how it differs from logistic regression, Kaplan-Meier curves and ANOVA, how to read a hazard ratio, the formula and its key assumption, and how to run it in SPSS. For help running and reporting the analysis itself, see SPSS, R and Python help in your discipline.
◆ Question 1 / 8 · What does a Cox regression
What does a Cox regression tell you?
Direct answer: A Cox regression tells you how much each predictor raises or lowers the hazard, the instantaneous risk of the event, while adjusting for the other predictors. The result is a hazard ratio for each variable, with a confidence interval and p value. It handles censored patients, whose event has not yet happened, without discarding them.
Cox (1972) introduced the model in a 1972 paper by treating the hazard as an unknown baseline multiplied by an exponential function of the predictors, which means you never have to specify the shape of survival over time. The paper was read before the Royal Statistical Society on 8 March 1972, at a meeting organised by the Society's Research Section (Cox, 1972, p. 187). Censoring is central to the idea. Cox describes censored individuals in plain terms: "for the censored individuals we know only that the time to failure is greater than the censoring time" (Cox, 1972, p. 187).
Andrade (2023), a two-page primer, stresses the practical consequence for clinical research. Patients who drop out or are still event-free when the study ends stay in the analysis, so their follow-up time still counts. A health science student can therefore analyse a cohort in which only some patients relapse, and report one adjusted effect per predictor.
◆ Question 2 / 8 · Is Cox regression the same
Is Cox regression the same as logistic regression?
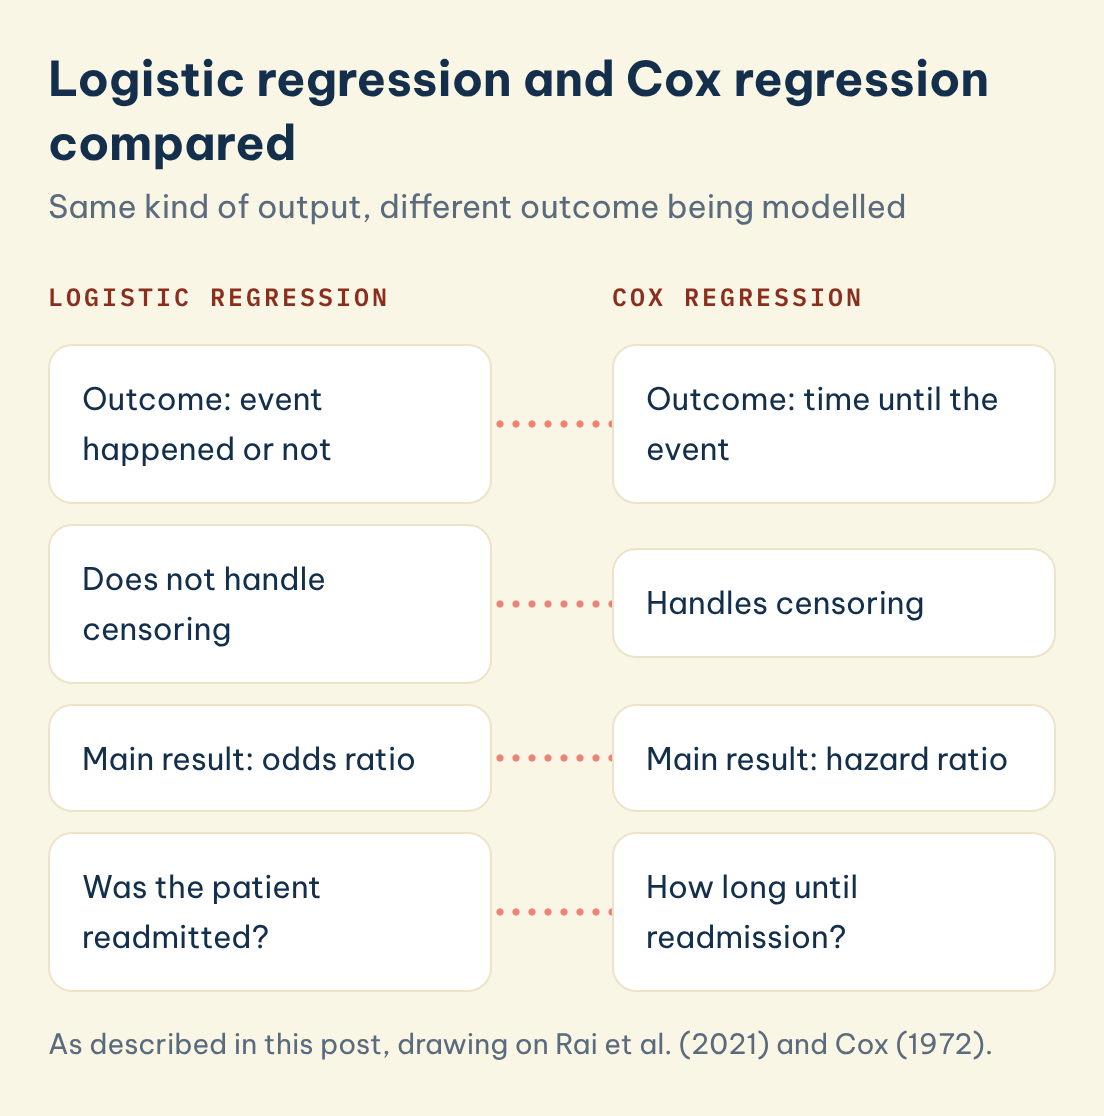
Direct answer: No. Logistic regression models whether an event happened, a yes or no outcome, and reports odds ratios. Cox regression models when it happened, using the follow-up time of every patient, and reports hazard ratios. Choose Cox when follow-up lengths differ and some patients are censored. Choose logistic when time does not matter.
Rai et al. (2021) describe the hazard ratio as analogous to an odds ratio, which explains why the two outputs look alike and why students confuse them. The difference lies in what is modelled. Logistic regression collapses each patient into survived or died at a fixed point, so a patient followed for two months and one followed for five years look identical. Cox regression keeps that timing information.
If your outcome really is a fixed-point yes or no, our guide to binary logistic regression and odds ratios shows how to read that model. For a health study with variable follow-up, the Cox model is usually the better fit, and your supervisor can confirm which your department expects.
| Feature | Logistic regression | Cox regression |
|---|---|---|
| Outcome | Event happened or not | Time until the event |
| Handles censoring | No | Yes |
| Main result | Odds ratio | Hazard ratio |
| Typical health question | Was the patient readmitted? | How long until readmission, adjusting for age and treatment? |
Logistic regression and Cox regression compared
Same kind of output, different outcome being modelled
Logistic regression
Cox regression
Outcome: event happened or not
Outcome: time until the event
Does not handle censoring
Handles censoring
Main result: odds ratio
Main result: hazard ratio
Was the patient readmitted?
How long until readmission?
Save this figure
◆ Question 3 / 8 · What is the difference
What is the difference between Kaplan-Meier and Cox regression?
Direct answer: Kaplan-Meier describes survival for one or two groups with a stepped curve and compares them with a log-rank test. Cox regression goes further by adjusting for several predictors at once, including continuous ones such as age. Most reports use both: Kaplan-Meier to show the curves, Cox to estimate adjusted hazard ratios.
Kaplan and Meier (1958) proposed in 1958 the product-limit estimate of survival from lifetimes that include losses to follow-up, without assuming any particular form for the survival curve. Rai et al. (2021) state the practical assumption behind the method: Kaplan-Meier assumes censoring is independent of the likelihood of the event.
The log-rank test, as Rai et al. (2021) explain, tests the null hypothesis of no difference between survival curves. It compares groups but cannot adjust for age, sex or disease stage. Showing the numbers at risk under a Kaplan-Meier figure, with the log-rank p value, helps a reader judge how much data sits behind each part of the curve. A Cox model then supplies the adjusted effect that a marker usually wants to see.
◆ Question 4 / 8 · What is the difference
What is the difference between ANOVA and Cox regression?
Direct answer: ANOVA compares the means of a continuous outcome across groups, such as average blood pressure in three treatment arms. Cox regression compares the risk of an event over time, so it suits outcomes like survival or relapse. ANOVA has no way to handle censored patients, which is why it cannot replace a survival model.
An ANOVA needs a measured score for every participant, and it works with group means. A time-to-event outcome is different, because for a censored patient you know only that the event had not happened yet. Averaging those incomplete times would understate the true follow-up and bias the comparison. If your outcome is a continuous score at one time point, our guide to one-way ANOVA is the right starting point.
Cox regression also accepts several predictors at once, categorical and continuous, in a single model. That makes it closer in spirit to multiple regression than to ANOVA, with the hazard replacing the mean as the quantity being modelled.
◆ Question 5 / 8 · How do you read a hazard
How do you read a hazard ratio?
Direct answer: A hazard ratio above 1 means a higher risk of the event, below 1 means a lower risk, and exactly 1 means no difference. A ratio of 0.50 means half the hazard at any given time, and 1.5 means a 50% higher hazard. Always report the 95% confidence interval and p value next to the ratio.
Andrade (2023) gives the lower-risk example: a hazard ratio of 0.50 means patients in one group are at half the hazard of relapse at a given time. Denfeld et al. (2023) give the higher-risk example, where a hazard ratio of 1.5 means a 50% higher hazard, and they ask authors to report 95% confidence intervals. A hazard ratio compares the instantaneous rate of the event, not the cumulative proportion of patients who have had it by the end of follow-up, so avoid writing it up as a ratio of overall risks. Dey et al. (2020) phrase it the same way, with 0.5 meaning half as many events in the treatment group at a given time.
| Hazard ratio | Plain-language reading | Source |
|---|---|---|
| 0.50 | Half the risk of the event | Andrade (2023) |
| 1.00 | No difference in risk | Rai et al. (2021) |
| 1.50 | 50% higher hazard of the event at any time | Denfeld et al. (2023) |
A hazard ratio of 0.50 and one of 1.5 sit on opposite sides of 1, so the first signals protection and the second signals added risk. A short results sentence names the outcome, the predictor and its reference group, the hazard ratio, the interval and the p value. For example, you might write that the treatment group had half the hazard of relapse (HR 0.50) and then give the interval from your own output. The numbers in that sentence should come from your data, never from a textbook example.
◆ Question 6 / 8 · What is the Cox regression
What is the Cox regression formula and its main assumption?
Direct answer: The model writes the hazard at time t as an unspecified baseline hazard multiplied by the exponential of the predictors times their coefficients. Exponentiating a coefficient gives the hazard ratio. The main assumption is proportional hazards: the hazard ratio stays constant over time, so the effect of a predictor does not strengthen or fade.
Cox (1972) set out this form. Denfeld et al. (2023) state the practical rule: hazard ratios are assumed constant over time, and you should test that visually and numerically before trusting the model.
Two common checks are used, one numerical and one graphical, and Dey et al. (2020) give an overview of assumption checking for survival studies. Plot the scaled Schoenfeld residuals against time and look for no pattern, or draw log(-log(survival)) curves for each group and look for parallel lines. If the lines cross or the residuals trend, the assumption is in doubt, and your methods chapter should say how you handled it, for example by adding a time interaction or stratifying.
◆ Question 7 / 8 · How do you run Cox
How do you run Cox regression in SPSS?
Direct answer: In SPSS you open the Cox Regression dialog from the Analyze menu under Survival. You enter the time variable, define the event variable and the value that marks the event, then add your predictors as covariates. Request the exp(B) confidence interval and a survival plot, then read the hazard ratio in the exp(B) column.
Define the event carefully, because a mistake here reverses your results. If 1 means the patient relapsed and 0 means no relapse, tell SPSS that 1 is the event. Categorical predictors need their reference category set deliberately, since the hazard ratio is always relative to that group. Check your coding against your data file before you interpret any number.
Software output is only half of the job. A complete report has at least 4 parts: the time variable and its unit, the number of events, the number censored and the proportional hazards check. Rai et al. (2021) and Denfeld et al. (2023) both give reporting guidance written for clinicians, and Dey et al. (2020) add a checklist-style overview of reporting for survival studies.
◆ Question 8 / 8 · Can a mentor help you report
Can a mentor help you report a Cox regression?
Many students can produce Cox output on their own, and learning to read it is worth the effort. A mentor helps with judgement calls that are hard to make alone: whether your event and censoring coding is right, whether the proportional hazards check supports your model, and whether your hazard ratio sentences read clearly to a marker. Through SPSS, R and Python help in your discipline, a MAAS expert works with you on your own data, explains each step and reviews the interpretation you write, with your supervisor's expectations as the reference point.
Frequently asked questions
What does a Cox regression tell you?
It tells you how each predictor changes the hazard of an event over time, adjusted for the other predictors, as a hazard ratio with a confidence interval (Andrade, 2023).
Is Cox regression the same as logistic regression?
No. Logistic regression models whether an event occurred and gives odds ratios, while Cox regression models the time to the event and gives hazard ratios (Rai et al., 2021).
What is the difference between Kaplan-Meier and Cox regression?
Kaplan-Meier estimates and plots survival for groups without adjustment, while Cox regression adjusts for several predictors at once (Kaplan & Meier, 1958; Cox, 1972).
What is the difference between ANOVA and Cox regression?
ANOVA compares group means of a continuous outcome. Cox regression compares event risk over time and can handle censored patients (Cox, 1972).
What is a good hazard ratio?
It depends on the question. A ratio below 1 means lower risk and above 1 means higher risk, so judge it with its confidence interval (Denfeld et al., 2023).
How do you check the proportional hazards assumption?
Plot scaled Schoenfeld residuals against time, or draw log(-log(survival)) curves and look for parallel lines (Dey et al., 2020).
References
Andrade, C. (2023). Survival analysis, Kaplan-Meier curves, and Cox regression: Basic concepts. Indian Journal of Psychological Medicine, 45(4), 434–435. https://doi.org/10.1177/02537176231176986
Cox, D. R. (1972). Regression models and life-tables. Journal of the Royal Statistical Society: Series B (Methodological), 34(2), 187–202. https://doi.org/10.1111/j.2517-6161.1972.tb00899.x
Denfeld, Q. E., Burger, D., & Lee, C. S. (2023). Survival analysis 101: An easy start guide to analysing time-to-event data. European Journal of Cardiovascular Nursing, 22(3), 332–337. https://doi.org/10.1093/eurjcn/zvad023
Dey, T., Mukherjee, A., & Chakraborty, S. (2020). A practical overview and reporting strategies for statistical analysis of survival studies. Chest, 158(1S), S39–S48. https://doi.org/10.1016/j.chest.2020.03.015
Kaplan, E. L., & Meier, P. (1958). Nonparametric estimation from incomplete observations. Journal of the American Statistical Association, 53(282), 457–481. https://doi.org/10.1080/01621459.1958.10501452
Rai, S., Mishra, P., & Ghoshal, U. C. (2021). Survival analysis: A primer for the clinician scientists. Indian Journal of Gastroenterology, 40(5), 541–549. https://doi.org/10.1007/s12664-021-01232-1
Tools & resources
Not sure how this guide applies to your own case? Talk it through with MAAS in a free 20-minute consultation.
Book a free consultation ▸