
◆ Research Methods
Welch's t-test vs Student's t-test: which should you use?
Welch's t-test compares two group means without assuming the groups have equal variances, and Student's t-test does assume it. Delacre, Lakens and Leys (2017) argue that Welch's version should be the default for independent groups, because the two-step habit of testing variances first is itself unreliable.
This guide covers the difference between the two tests, the Welch–Satterthwaite degrees of freedom, how to read the "Equal variances not assumed" row in SPSS, the opposite software defaults in R and SciPy, how to report the result in APA 7, and why a preliminary Levene's test is a poor way to choose. The sibling guide on choosing the right statistical test places this decision inside the wider map of tests.
◆ Question 1 / 9 · The difference
What is the difference between a t-test and Welch's t-test?
Direct answer: Student's t-test pools the two sample variances into one estimate and assumes the populations share the same variance, with degrees of freedom of n1 + n2 − 2. Welch's t-test keeps the variances separate and adjusts the degrees of freedom, so it stays valid when the spreads differ (Delacre et al., 2017).
Welch (1947) proposed the separate-variances approach, and Delacre et al. (2017) describe it as dividing the mean difference by an unpooled error term. The t statistic is the mean difference divided by the square root of s1²/n1 + s2²/n2, which is the same formula NIST gives for the unequal-variance case (National Institute of Standards and Technology, n.d.). The only real change from Student's test is therefore the denominator and the degrees of freedom, not the question being asked.
| Feature | Student's t-test | Welch's t-test |
|---|---|---|
| Variance assumption | Both populations share one variance | Variances may differ |
| Error term | Pooled variance | Separate variances, s1²/n1 + s2²/n2 |
| Degrees of freedom | n1 + n2 − 2, always a whole number | Welch–Satterthwaite formula, usually a fraction |
Default in R t.test |
No | Yes |
Default in SciPy ttest_ind |
Yes | No (set equal_var=False) |
| SPSS output row | "Equal variances assumed" | "Equal variances not assumed" |
The software defaults in the table come from the R and SciPy documentation, and Delacre et al. (2017) note that Welch's test is already the default in R and Minitab.
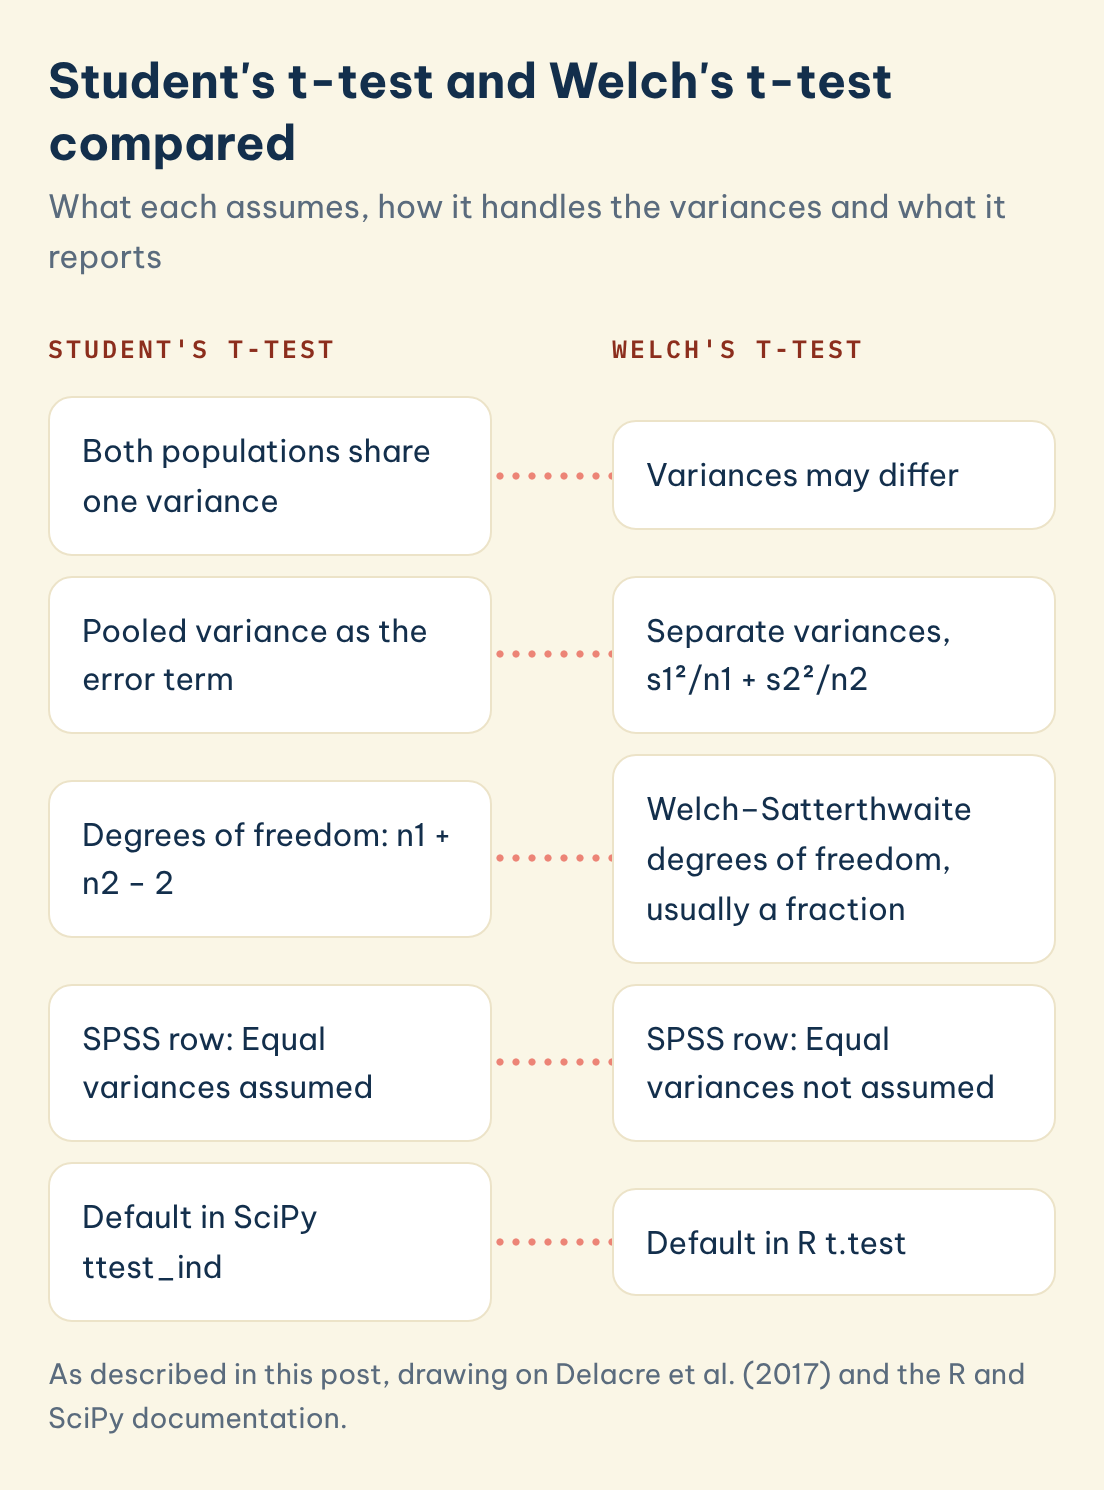
Student's t-test and Welch's t-test compared
What each assumes, how it handles the variances and what it reports
Student's t-test
Welch's t-test
Both populations share one variance
Variances may differ
Pooled variance as the error term
Separate variances, s1²/n1 + s2²/n2
Degrees of freedom: n1 + n2 − 2
Welch–Satterthwaite degrees of freedom, usually a fraction
SPSS row: Equal variances assumed
SPSS row: Equal variances not assumed
Default in SciPy ttest_ind
Default in R t.test
Save this figure
◆ Question 2 / 9 · Degrees of freedom
What are the Welch–Satterthwaite degrees of freedom?
Direct answer: The Welch–Satterthwaite formula is ν = (s1²/N1 + s2²/N2)² divided by [(s1²/N1)²/(N1 − 1) + (s2²/N2)²/(N2 − 1)]. It lowers the degrees of freedom as the group variances or sizes drift apart, which makes the test slightly more cautious than Student's (National Institute of Standards and Technology, n.d.).
NIST states that "the Welch-Satterthwaite degrees of freedom are robust for unequal sample sizes and/or unequal variances" (National Institute of Standards and Technology, n.d.). Delacre et al. (2017) print the same expression as their equation 4, and it is the reason a Welch result so often shows a value such as 47.97 instead of a whole number.
Do not round the fraction when you report it. Report the degrees of freedom exactly as your software prints them, because the fraction is the visible sign that Welch's correction was applied. If your output shows a whole number such as 48 for a two-group comparison with 50 participants, you are most likely looking at the Student row.
◆ Question 3 / 9 · When to use Welch
When should you use Welch's t-test instead of Student's?
Direct answer: Use Welch's t-test whenever you compare the means of two independent groups, which is what Delacre et al. (2017) recommend. Student's test only has an edge when the variances are truly equal, and then Welch loses little. Unequal group sizes with unequal variances are where Student's test misleads most.
Delacre et al. (2017) conclude that "Welch's t-test should always be used instead of Student's t-test" (p. 99). Their reasoning is practical: "because there is no correct test to perform that assures SDR = 1, and because variances are likely not to be equal in certain research areas, our recommendation is to always use Welch's t-test" (p. 97). SDR here is the ratio of the two standard deviations.
The cost of ignoring this depends on the pairing of variance and sample size. When the larger variance sits with the smaller sample, Student's Type 1 error rate is inflated, and when the larger variance sits with the larger sample, the rate drops below the nominal level (Delacre et al., 2017). In one simulation with groups of 40 and 60 and a standard deviation ratio of 0.5, p-values below .05 occurred in 8.3% of runs when the larger variance went with the smaller sample (Delacre et al., 2017, p. 98). Equal group sizes soften the problem, which is why Student's test survives in textbooks.
Two points keep this honest. First, the 2017 paper has a published correction that leaves the main message intact, namely that Welch's test should be privileged over Student's when comparing means (Delacre et al., 2022). Second, Welch's advantage is about error control with unequal variances, not about magic: it still assumes roughly normal data, and a very small group makes any t-test fragile.
◆ Question 4 / 9 · Why not Levene
Why should you not choose between them with Levene's test?
Direct answer: Delacre et al. (2017) advise against the two-step routine of running Levene's test and then picking Student's or Welch's. The preliminary test has low power with small samples, and running two tests on the same data makes the alpha level and power of the t-test depend on Levene's outcome.
Many courses still teach the routine. A University of Southern Queensland open textbook, for example, tells students that the output shows two rows, one for equal variances assumed and one for equal variances not assumed, and links the choice to Levene's test (Statistics for Research Students, section 3.3). You may have to follow that routine for a unit that marks it, so read the unit guide first.
The statistical objection is documented. Delacre et al. (2017, p. 99) write that "the widely recommended two-step approach, where the assumption of equal variances is tested using Levene's test and, based on the outcome of this test, a choice of Student's t-test or Welch's t-test is made, should not be used". They also report that detecting a standard deviation ratio of 1.5 with Levene's test needs about 120 participants for power of 0.80 (Delacre et al., 2017, p. 94). Zimmerman (2004) reached a similar verdict from simulations, finding that the two-stage procedure fails to protect the significance level and usually makes the situation worse.
The practical advice is short. Report Welch's result as your primary test, and if your marker expects a Levene's check, report it as a descriptive note rather than as the gatekeeper.
◆ Question 5 / 9 · SPSS, R and SciPy
How do you read the SPSS output and the R and SciPy defaults?
Direct answer: In SPSS, read the "Equal variances not assumed" row, which is the Welch test. R's t.test already runs Welch by default (var.equal = FALSE), but SciPy's ttest_ind defaults to Student's test (equal_var = True), so you must set equal_var=False yourself.
Navarro's open SPSS tutorial explains that SPSS outputs both the Student t and Welch's t, and that the second row is the Welch test (Learning Statistics with SPSS, section 10.4). Take the t, df and Sig. (2-tailed) values from that row, plus the confidence interval of the difference in the same row.
For R, the documentation says that if var.equal is TRUE the pooled variance is used, and otherwise the Welch (or Satterthwaite) approximation to the degrees of freedom is used (R Core Team, n.d.). For Python, the SciPy documentation states that equal_var=True is the default and performs the standard test, while False performs Welch's t-test, which does not assume equal population variance (SciPy community, n.d.). A student who pastes a SciPy call without the argument and writes "Welch's t-test" in the methods section has reported the wrong test. This is a common slip when moving between R and Python.
# R: Welch by default
t.test(score ~ group, data = d)

# Python (SciPy): switch Welch on explicitly
from scipy import stats
stats.ttest_ind(a, b, equal_var=False)
If your software offers neither a clear label nor a documented default, look up the documentation page for your version before you name the test in writing.
◆ Question 6 / 9 · Reporting in APA 7
How do you interpret and report Welch's t-test in APA 7?
Direct answer: Report the t statistic, the fractional degrees of freedom, the exact p value, the group descriptives and the confidence interval for the mean difference, and name the test as Welch's. The example below uses invented numbers for illustration only, so replace them with your own output.
Here is a hypothetical example. Suppose a group of 18 students on a revised tutorial scored M = 72.4 (SD = 6.1) and a comparison group of 32 scored M = 66.8 (SD = 11.3). The standard deviations differ by almost a factor of two, so Welch's test is the sensible choice. The calculation gives a standard error of 2.46, t(47.97) = 2.28, p = .027, with a 95% confidence interval for the mean difference of about 0.65 to 10.55. Student's test on the same summary statistics gives t(48) = 1.94, p = .058, which would flip the conclusion at the .05 level.
| Element | What to write | In the hypothetical example |
|---|---|---|
| Test name | State that Welch's t-test was used | Welch's t-test for independent samples |
| Statistic and df | t(df) with the fractional df | t(47.97) = 2.28 |
| p value | Exact value, three decimals | p = .027 |
| Descriptives | M and SD for each group | 72.4 (6.1) and 66.8 (11.3) |
| Interval | 95% CI for the mean difference | [0.65, 10.55] |
A sample sentence in APA 7 style reads: "Welch's t-test showed that the revised tutorial group (M = 72.4, SD = 6.1, n = 18) scored higher than the comparison group (M = 66.8, SD = 11.3, n = 32), t(47.97) = 2.28, p = .027, 95% CI [0.65, 10.55]." Add an effect size as well, and the guide on reporting effect sizes and confidence intervals shows how.
To interpret the result, read the sentence the way a marker would. A p value below your alpha (usually .05) means the data would be unlikely if the population means were equal, and the confidence interval tells the reader how large the difference might plausibly be.
◆ Question 7 / 9 · Mann-Whitney
When should you use Welch's t-test and when Mann-Whitney?
Direct answer: Use Welch's t-test when you want to compare means and the data are approximately continuous and roughly normal within each group. Use Mann-Whitney when your scale is ordinal or the distributions are badly non-normal. Mann-Whitney is not a cure for unequal variances (Delacre et al., 2017).
Delacre et al. (2017) explicitly list the belief that the Mann-Whitney test copes with unequal variances as a mistaken one (note 6, p. 99). Ruxton (2006) goes further in the title of his short article, arguing that the unequal variance t-test is an underused alternative to both Student's test and the Mann-Whitney U test. The two tests also answer different questions: Welch compares means, while Mann-Whitney compares rank distributions, so switching between them changes your research claim and not only your method.
A sensible order for a student is to look at the scale of measurement and the distribution shape first, then choose between a mean-based test (Welch) and a rank-based test (Mann-Whitney). Justify the choice in one sentence in your methods section, and avoid switching tests after seeing which one gives the smaller p value.
◆ Question 8 / 9 · Sample size and p
How do sample size and the p value work with Welch's test?
Direct answer: Welch's test has no separate sample-size rule, and Delacre et al. (2017) say it has practically the same power as Student's test even when the standard deviations are equal. The exact p value comes from the t distribution at the Welch degrees of freedom, so it will differ slightly from Student's.
Student's test is described as robust to unequal variances when group sizes are equal, provided each group is large enough to give correct estimates of means and standard deviations, which Delacre et al. (2017, p. 92) put at n ≥ 5. That is a floor for estimation and not a power calculation, so this guide gives no target sample size. If your unit asks for one, take the method from your unit guide or your supervisor.
Because the degrees of freedom are fractional, tables of critical values are of little help. Read the exact p value from your software, and report it to three decimals (or as p < .001 for very small values), as in the example above.
◆ Question 9 / 9 · Mentor help
Can a mentor help with choosing and reporting the test?
Many students lose marks not on the arithmetic but on the choice and the write-up: naming Student's test while the output used Welch, rounding the degrees of freedom, or defending Levene's test as a gatekeeper. In data analysis support at MAAS, a mentor guides you through the logic of the comparison, how to read the output from SPSS, R or Python, and how to word the result. You run the analysis and write the results yourself, and your supervisor and institution decide the outcome. Bring your dataset description, your unit's reporting requirements and the exact output you have so far to the first session, so the discussion stays on your assignment and not on a generic example.
Frequently asked questions
What is the main difference between Student's t-test and Welch's t-test?
Student's test pools the variances and assumes they are equal, with n1 + n2 − 2 degrees of freedom. Welch's test uses the separate variances and adjusts the degrees of freedom (Delacre et al., 2017).
Should I run Levene's test before choosing a t-test?
Delacre et al. (2017) advise against this two-step routine because the preliminary test can be underpowered and it makes the t-test's error rates depend on its outcome. Use Welch's test directly unless your unit requires otherwise.
Why do I get decimal degrees of freedom?
The Welch–Satterthwaite formula produces a fractional value that depends on the variances and group sizes (National Institute of Standards and Technology, n.d.). Report it as your software prints it.
Does R or Python use Welch's t-test by default?
R's t.test uses Welch's approximation by default, while SciPy's ttest_ind defaults to Student's test and needs equal_var=False for Welch (R Core Team, n.d.; SciPy community, n.d.).
Is Welch's t-test a non-parametric test?
No. It is a parametric test of means that assumes roughly normal data, and it differs from the rank-based Mann-Whitney test (Delacre et al., 2017).
Can I run Welch's t-test in Excel?
This guide does not cover Excel steps. Check Microsoft's current documentation for your version before relying on a spreadsheet function. Whatever tool you use, confirm that it runs the unequal-variances version and read its help page before naming the test in your report.
References
Delacre, M., Lakens, D., & Leys, C. (2017). Why psychologists should by default use Welch's t-test instead of Student's t-test. International Review of Social Psychology, 30(1), 92–101. https://doi.org/10.5334/irsp.82
Delacre, M., Lakens, D., & Leys, C. (2022). Correction: Why psychologists should by default use Welch's t-test instead of Student's t-test. International Review of Social Psychology, 35(1), Article 21. https://doi.org/10.5334/irsp.661
National Institute of Standards and Technology. (n.d.). Two-sample t-test for equal means. In NIST/SEMATECH e-handbook of statistical methods. https://www.itl.nist.gov/div898/handbook/eda/section3/eda353.htm
R Core Team. (n.d.). Student's t-test (t.test). In The R stats package. https://stat.ethz.ch/R-manual/R-devel/library/stats/html/t.test.html
Ruxton, G. D. (2006). The unequal variance t-test is an underused alternative to Student's t-test and the Mann-Whitney U test. Behavioral Ecology, 17(4), 688–690. https://doi.org/10.1093/beheco/ark016
SciPy community. (n.d.). scipy.stats.ttest_ind. In SciPy documentation. https://docs.scipy.org/doc/scipy/reference/generated/scipy.stats.ttest_ind.html
Welch, B. L. (1947). The generalization of "Student's" problem when several different population variances are involved. Biometrika, 34(1–2), 28–35. https://doi.org/10.1093/biomet/34.1-2.28
Zimmerman, D. W. (2004). A note on preliminary tests of equality of variances. British Journal of Mathematical and Statistical Psychology, 57(1), 173–181. https://doi.org/10.1348/000711004849222
Tools & resources
Not sure how this guide applies to your own case? Talk it through with MAAS in a free 20-minute consultation.
Book a free consultation ▸