
◆ Research Methods
How do you run and interpret a two-way ANOVA with interactions?
To run and interpret a two-way ANOVA, check the assumptions, test the interaction first, and interpret the main effects with care, or by group, if the interaction is significant. If it is significant, run follow-up tests within each level of the other factor. Report F, degrees of freedom, exact p and an effect size.
◆ Question 1 / 11 · Purpose
What is a two-way ANOVA test for?
Direct answer: A two-way ANOVA tests whether the mean of one continuous outcome differs across the groups made by two categorical factors, and whether the two factors work together. Marshall (n.d.-b) describes three hypotheses: a main effect of each factor and an interaction between them.
The design is stated plainly in a statstutor workbook: "Two way ANOVA has two categorical independent variables and tests three hypotheses" (Marshall, n.d.-a, p. 39). The outcome must be continuous, such as weight lost in kilograms. The two factors are categorical, such as diet type and gender. Laerd Statistics (n.d.) adds a boundary: a continuous covariate turns the test into a two-way ANCOVA, and three factors make it a three-way ANOVA.
The reason to use a two-way design instead of two separate tests is the third hypothesis. Two one-way tests can tell you that diet matters and that gender matters, but they cannot tell you whether the effect of diet is the same for women and men. The interaction term answers that question. Many dissertation hypotheses are really interaction hypotheses ("the training works better for new staff than for experienced staff") written as if they were main effects, so decide which of the three you are actually testing before you open SPSS.
◆ Question 2 / 11 · One-way vs two-way
What is the difference between a one-way and a two-way ANOVA?
Direct answer: A one-way ANOVA has one categorical factor and tests one hypothesis. A two-way ANOVA has two factors and tests three: each main effect and their interaction. The extra hypothesis is the point of the design, because it shows whether one factor's effect depends on the other.
The table below sets the two designs side by side, using the Marshall (n.d.-b) diet example of 78 people on three diets, split by gender.
| Feature | One-way ANOVA | Two-way ANOVA |
|---|---|---|
| Categorical factors | One (diet) | Two (diet and gender) |
| Hypotheses tested | One | Three |
| Question answered | Do group means differ? | Do they differ for each factor, and does one factor change the other's effect? |
| Typical follow-up | Post hoc comparisons | Check the interaction first, then simple main effects or post hoc tests |
With one factor, a significant result sends you straight to post hoc tests. With two, the order of reading matters, which is why the later sections spend more time on the interaction than on the main effects.
◆ Question 3 / 11 · Two-way vs three-way
What is the difference between a two-way and a three-way ANOVA?
Direct answer: A three-way ANOVA adds a third categorical factor. Laerd Statistics (n.d.) states that three independent variables call for a three-way ANOVA. It tests three main effects, three two-way interactions and one three-way interaction, which makes the output harder to read and the sample requirements larger.
Add a factor and every combination of levels becomes a cell that needs enough participants. A 2 x 3 design has 6 cells, while a 2 x 3 x 2 design has 12. Interactions between three factors are also hard to explain in words, since you are describing how a two-way pattern changes across the levels of a third variable.
For a taught dissertation, the practical advice is to ask whether the third factor is a question you want to answer or a control variable. If it is a control, a covariate in a two-way ANCOVA may be a better fit than a third factor. If your supervisor asks for a three-way design, treat the sample size as the first constraint, and read the power section below before you collect data.
◆ Question 4 / 11 · Assumptions
What assumptions does a two-way ANOVA make?
Direct answer: The main assumptions are independent observations, a continuous outcome, roughly normal residuals, equal variances across cells, and no extreme outliers. Marshall (n.d.-b) checks normality with saved residuals and equal variances with Levene's test. Laerd Statistics (n.d.) lists six assumptions in all.
Independence comes from your design, not from any test. If the same people appear in more than one cell, Laerd Statistics (n.d.) says you need a different procedure. For normality, Marshall (n.d.-b) saves the standardised residuals and looks at their histogram, while Laerd Statistics (n.d.) uses Shapiro-Wilk for each combination of the factors and notes that the test is robust to slight departures from normality.
For equal variances, Marshall (n.d.-b) reads Levene's test: if p is above .05, equal variances can be assumed. If p is below .05, the results are less reliable, and Marshall (n.d.-b) accepts comparing the ANOVA p-values with .01 instead of .05 as a cautious response. If the residuals are very skewed, Marshall (n.d.-b) notes that SPSS has no non-parametric equivalent for this design. The options are to transform the outcome or to run a separate ANOVA for each group. State which check you ran and what it showed, because a methodology chapter that skips this step reads as if the tests were run without looking at the data.
◆ Question 5 / 11 · Running it in SPSS
How do you run a two-way ANOVA in SPSS?
Direct answer: In SPSS, choose Analyze > General Linear Model > Univariate, place the outcome in Dependent Variable and both factors in Fixed Factor(s), then add a means plot and post hoc tests. Marshall (n.d.-b) uses this route, and its output table is labelled "Type III Sum of Squares".
Marshall (n.d.-b) also points to the Plots menu for the means plot and to Tukey for post hoc comparisons. Request estimates of effect size at the same time, so you do not have to go back later, and save the standardised residuals for the normality check above. Run Levene's test from the same dialog. Then read the output in a fixed order: the assumption checks first, the interaction row of the ANOVA table second, the plot third, and only then the main effects.
If you would rather have someone check your set-up before you collect more data, the MAAS SPSS and Python data analysis service is advisory. A MAAS expert guides you through the analysis and its interpretation, while you run the tests and write the results yourself.
◆ Question 6 / 11 · The ANOVA table
How do you read the two-way ANOVA table?
Direct answer: The table has one row per effect: factor A, factor B, the A x B interaction, the error and the total. Each effect row gives a sum of squares, degrees of freedom, F and a p-value. Read the interaction row before the main-effect rows.
The next table shows the three effect rows for the Marshall (n.d.-b) diet example. Only the figures the source reports are included.
| Effect | Result reported by Marshall (n.d.-b) |
|---|---|
| Diet | p = .013 |
| Gender | p = .779 |
| Diet x Gender | F(2, 70) = 3.153, p = .049 |
The degrees of freedom for the interaction are 2, which is the product of the degrees of freedom of the two factors (2 for three diets, 1 for two genders). The second number in F(2, 70) is the error degrees of freedom, which is the same for every effect row in the table, so check that it matches the number of cases actually analysed minus the number of cells before you trust the output. In the diet example the error df of 70 means 76 cases were analysed, not 78.
On a first reading, a main effect for diet and no main effect for gender looks like a clean story: diet matters, gender does not. The interaction row says otherwise, and that is the whole reason to read it first.
◆ Question 7 / 11 · Main effect vs interaction
What is the difference between a main effect and an interaction?
Direct answer: A main effect is the average difference across one factor, ignoring the other. An interaction means the effect of one factor changes across the levels of the other. On a means plot, non-parallel lines suggest an interaction, which the F-test then confirms or rejects.
Marshall (n.d.-b) shows the check in the diet data: the lines on the plot are not parallel, and the interaction is significant. Parallel lines mean the effect of diet is about the same for women and men. Lines that cross or fan out mean it is not. A plot alone is a prompt to test, not a result.
A concrete way to think about it: imagine a training programme tested on new and experienced staff. A main effect of programme says that, averaged over staff type, the trained group scores higher. An interaction says the gain is large for new staff and negligible for experienced staff. The second finding changes what you recommend, and the average in the first would hide it. That is why the sources agree on the same rule: when the interaction is significant, interpreting the main effects alone can mislead. Marshall (n.d.-b) states this directly for the diet result, where the interaction was significant (p = .049).
◆ Question 8 / 11 · Significant interaction
What should you do when the interaction is significant?
Direct answer: Follow up with simple main effects: test one factor separately at each level of the other. Marshall (n.d.-a, p. 40) says: "If there is a significant interaction, split the data file and carry out an ANOVA of diet for each gender as SPSS does not automatically do this for significant interactions."
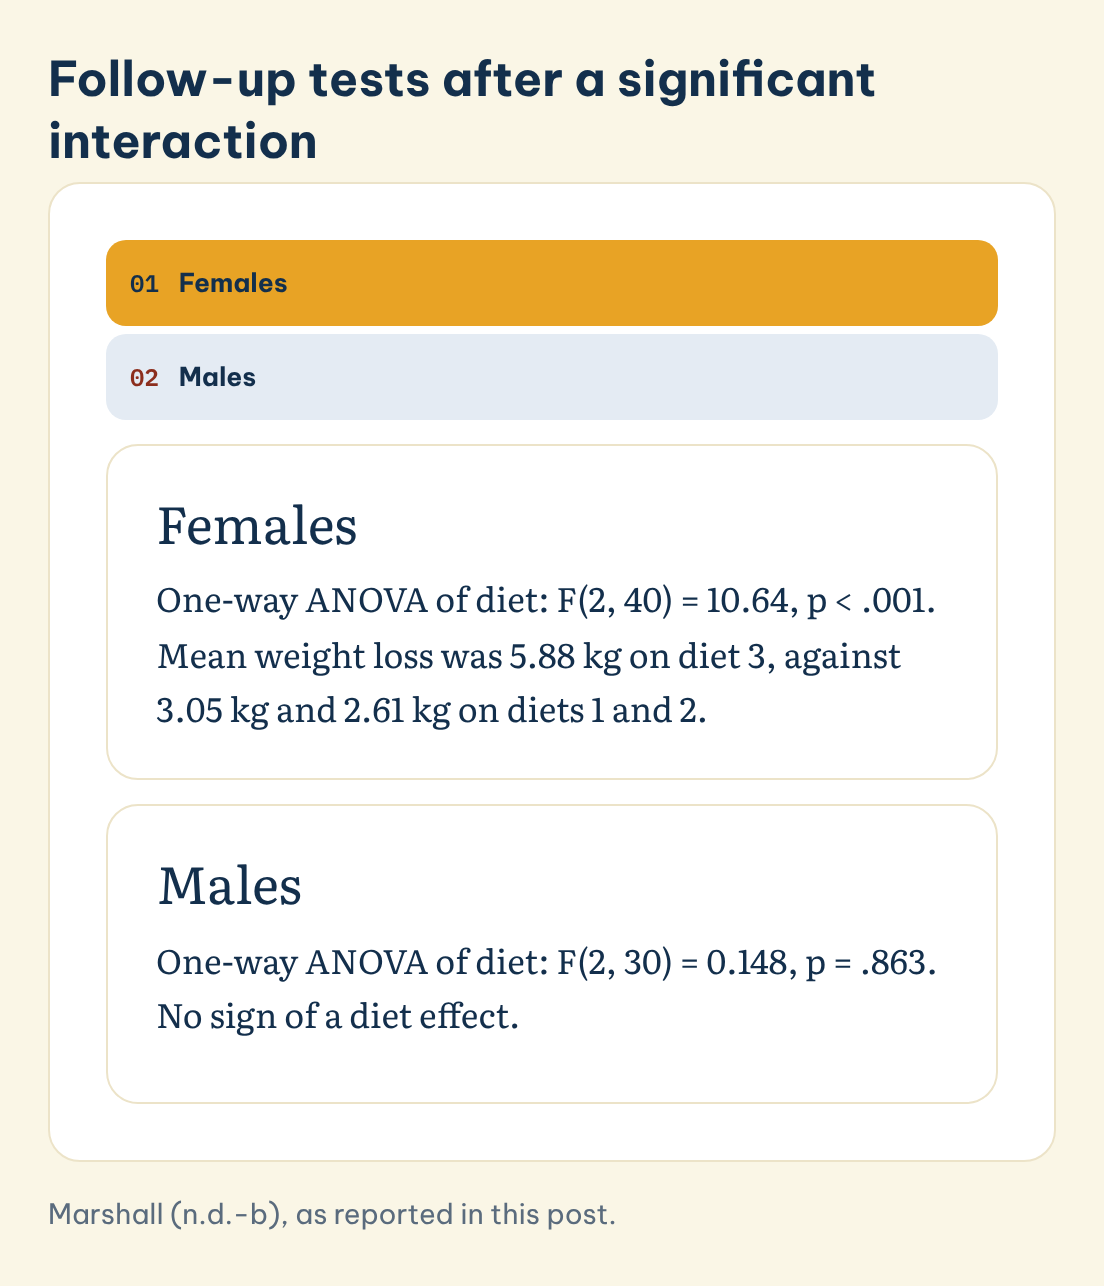
Follow-up tests after a significant interaction
Tap a group to see the simple effect of diet within it.
Females
One-way ANOVA of diet: F(2, 40) = 10.64, p < .001. Mean weight loss was 5.88 kg on diet 3, against 3.05 kg and 2.61 kg on diets 1 and 2.
Males
One-way ANOVA of diet: F(2, 30) = 0.148, p = .863. No sign of a diet effect.
Save this figure
Marshall (n.d.-a, p. 40) adds that "The main effects need to be discussed by group e.g. for males/ females separately." In the diet example, Marshall (n.d.-b) splits the file by gender and runs a one-way ANOVA of diet within each group. Laerd Statistics (n.d.) notes that recent versions of SPSS (28 to 30) can produce simple main effects from the interface, while version 27 or earlier needs syntax.
The follow-up results from Marshall (n.d.-b) are shown below.
| Group | Test | Result |
|---|---|---|
| Females | One-way ANOVA of diet | F(2, 40) = 10.64, p < .001 |
| Males | One-way ANOVA of diet | F(2, 30) = 0.148, p = .863 |
Among the women, diet 3 produced a mean weight loss of 5.88 kg, against 3.05 kg and 2.61 kg on diets 1 and 2 (Marshall, n.d.-b). Among the men, there was no sign of a diet effect. The significant overall diet effect (p = .013) therefore averaged a strong diet effect among women with no diet effect among men. The critical point for your discussion chapter is that the headline "diet matters" is true for one group only.
◆ Question 9 / 11 · Effect size
How do you calculate and report effect size?
Direct answer: Report partial eta squared for each effect, which is the share of variance an effect explains after removing the variance explained by the other effects. Lakens notes that "researchers predominantly report the effect size partial eta squared (η2p), which is provided by statistical software packages such as SPSS" (Lakens, 2013, p. 1).
A p-value says whether an effect is likely to be noise, not how large it is. Lakens (2013) warns that partial eta squared depends on the design: the same mean difference gave .26 in a between-subjects design and .71 in a within-subjects design. This means you should not compare values across studies with different designs without saying so. For the wider question of effect sizes and confidence intervals, see our guide on how to report effect size and confidence intervals.
In a two-way table you get one partial eta squared per effect. Give the value for the interaction even when it is small, because readers want to know how much of the variation the interaction explains. This post does not quote a partial eta squared for the diet example because Marshall (n.d.-b) does not report one, so use the figures in your own output.
◆ Question 10 / 11 · APA 7 reporting
How do you report a two-way ANOVA in APA 7 format?
Direct answer: Report each F with its degrees of freedom in parentheses, the exact p-value, and the effect size, interaction first. The APA Style guide (American Psychological Association, 2020) asks for two decimals on F, exact p to two or three decimals, p < .001 for small values, and italic statistical symbols.
Applying those rules to the Marshall (n.d.-b) diet figures, a results paragraph could read as follows. Fill the effect sizes from your own output.
A two-way between-groups ANOVA examined the effects of diet and gender on weight loss. The interaction between diet and gender was significant, F(2, 70) = 3.15, p = .049, so the main effects were interpreted within each gender. Diet had a significant effect for women, F(2, 40) = 10.64, p < .001, but not for men, F(2, 30) = 0.15, p = .863.
Notice three details. The statistic is rounded to two decimals (3.153 becomes 3.15), there is no leading zero on p, and degrees of freedom never take a thousands separator (F(1, 1500), not 1,500). Laerd Statistics (n.d.) also advises reporting the interaction before the main effects, which matches the order above. Add partial eta squared after each F once you have it, and include a means table or plot so readers can see the pattern you describe.
◆ Question 11 / 11 · Sample size and power
How many participants do you need to detect an interaction?
Direct answer: Usually many more than you need for a main effect. Sommet et al. (2023) found, in 159 studies from influential psychology journals, that the median power to detect a typical-size interaction was .18 and only 17% reached .80. The required sample ranged from 128 to 5,632.
Lakens (2013) gives the conventional minimum for power as .80, taken from Cohen. Sommet et al. (2023) show how far interaction tests fall below it in practice. Their range of required sample sizes depends on the shape of the interaction: 128 for a reversed interaction, where the effect flips direction, up to 5,632 for a partially attenuated one, where the effect shrinks but keeps its direction.
Across those 159 studies, power of .18 means most real interactions of typical size would have been missed, and the 17% that reached .80 were the exception. For your own project, this finding has two consequences. First, a non-significant interaction in a small sample is weak evidence that no interaction exists, so word the conclusion with care. Second, if your hypothesis is about an interaction, plan the sample for the interaction, not for the main effects. Sommet et al. (2023) also point to the INT x Power tool (www.intxpower.com) for this calculation. Write the assumed interaction shape and the power analysis into your methodology chapter. A dissertation with fewer than 100 participants, like the diet example, can detect a strong pattern but should not claim much from a null interaction.
Frequently asked questions
What is a two-way ANOVA used for?
It tests whether a continuous outcome differs across two categorical factors and whether the factors interact. Marshall (n.d.-b) describes three hypotheses: two main effects and one interaction.
Do I interpret main effects if the interaction is significant?
Not on their own. Marshall (n.d.-b) warns that interpreting main effects can be misleading when the interaction is significant, and Marshall (n.d.-a, p. 40) says to discuss them by group.
What does it mean if the lines on the plot are not parallel?
It suggests an interaction. Marshall (n.d.-b) uses non-parallel lines as the visual sign, and the F-test for the interaction confirms it.
Does SPSS run simple main effects automatically?
Not through the split-file route. Marshall (n.d.-a, p. 40) says SPSS does not do this for you, while Laerd Statistics (n.d.) notes that versions 28 to 30 can produce simple main effects from the interface.
Which effect size should I report?
Partial eta squared, as Lakens (2013) notes it is the most commonly reported and SPSS provides it. State the design, because its value depends on it.
What if Levene's test is significant?
Marshall (n.d.-b) says the results are less reliable and accepts comparing p-values with .01 instead of .05. Also check your cell sizes and consider transforming the outcome.
Can I use a two-way ANOVA with repeated measures?
Not the between-groups version. Laerd Statistics (n.d.) says that if the same participants appear in more than one cell, you need another test. For help choosing, see how to choose the right statistical test.
References
American Psychological Association. (2020). Numbers and statistics guide [APA Style 7th ed. instructional aid]. https://apastyle.apa.org/instructional-aids/numbers-statistics-guide.pdf
Lakens, D. (2013). Calculating and reporting effect sizes to facilitate cumulative science: A practical primer for t-tests and ANOVAs. Frontiers in Psychology, 4, Article 863. https://doi.org/10.3389/fpsyg.2013.00863
Laerd Statistics. (n.d.). Two-way ANOVA in SPSS Statistics. https://statistics.laerd.com/spss-tutorials/two-way-anova-using-spss-statistics.php
Marshall, E. (n.d.-a). SPSS workbook for new statistics tutors. statstutor. https://statstutor.ac.uk/resources/uploaded/tutortrainingspssworkbook.pdf
Marshall, E. (n.d.-b). Two-way ANOVA in SPSS. University of Sheffield, Statstutor community project. https://www.sheffield.ac.uk/media/30968/download?attachment=
Sommet, N., Weissman, D. L., Cheutin, N., & Elliot, A. J. (2023). How many participants do I need to test an interaction? Conducting an appropriate power analysis and achieving sufficient power to detect an interaction. Advances in Methods and Practices in Psychological Science, 6(3). https://doi.org/10.1177/25152459231178728
Not sure how this guide applies to your own case? Talk it through with MAAS in a free 20-minute consultation.
Book a free consultation ▸