
◆ Research Methods
What does the Pearson correlation coefficient r tell you?
The Pearson correlation coefficient, written r, summarises how closely two continuous variables move together along a straight line. Schober et al. (2018) note that it runs from –1 to +1 whatever units were measured, which is why a value of r can be compared across studies that measured things in different units.
That compactness is also the trap. A single number hides the shape of the data, the influence of outliers and the size of the sample, so dissertation markers expect you to show the scatterplot, name the direction and strength in words, and report the test properly. This guide covers what r is used for, how to read it, whether 0.7 counts as strong, how r relates to R², when Spearman's rho is the better choice, and how to report the result.
◆ Question 1 / 8 · What r is used for
What is Pearson's correlation coefficient used for?
Direct answer: Pearson's r is used to measure the strength and direction of a linear relationship between two continuous variables, such as revision hours and exam score. Mukaka (2012) defines correlation in statistical terms as a way of assessing a possible two-way linear association, so r describes association and never, on its own, cause.
Mukaka opens the guide with a definition that applies to every student project: "Correlation is a statistical method used to assess a possible linear association between two continuous variables" (Mukaka, 2012, p. 69). The same abstract adds that misuse is so common some statisticians have wished the method had never been devised. Mukaka's paper, published in 2012 in volume 24 of the Malawi Medical Journal, illustrates the point with simulated samples of 500 observations at correlations of 0.2, 0.5, 0.8 and –0.8. Typical dissertation uses include checking whether job satisfaction rises with salary, whether screen time falls as sleep quality rises, or whether two survey scales measure related constructs before a regression.
Correlation does not imply causation. Akoglu (2018) gives the classic example: ice cream sales, drownings and forest fires all rise in the same season, yet none causes the others. When you write up r, phrase the result as "was associated with" rather than "led to", and keep causal language for designs that can support it.
◆ Question 2 / 8 · Interpreting r
How do you interpret a Pearson correlation coefficient?
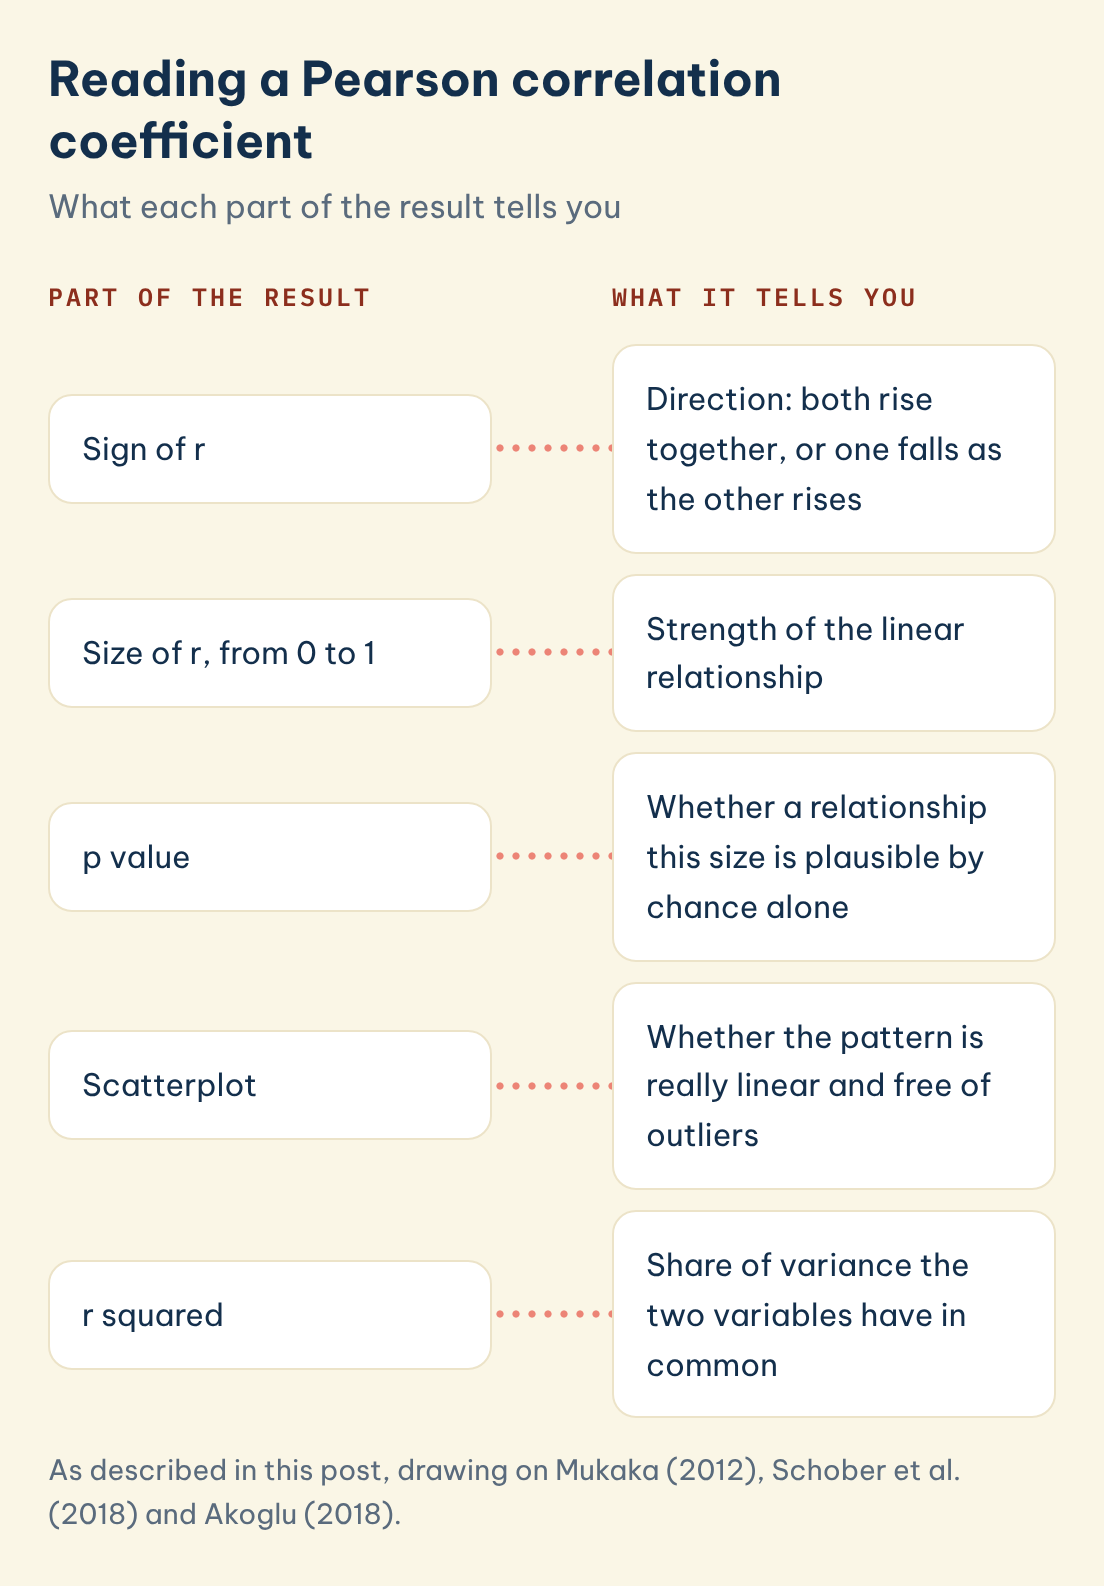
Direct answer: Read r in three parts. The sign gives the direction, so a positive r means both variables rise together and a negative r means one falls as the other rises. The absolute size gives the strength, where 0 means no linear relationship and ±1 means every point lies on a straight line (Mukaka, 2012).
Start with the scatterplot, not the number. Anscombe published the demonstration in 1973 in volume 27 of The American Statistician, using 4 datasets of 11 points each. Anscombe (1973) built four small datasets that share almost the same correlation yet look completely different when plotted, including one curved pattern and two shaped by outliers. A second caution is that r depends on the range of values you sampled, so a sample that covers only part of the range usually shows a weaker correlation than the full population would.
The table shows how the three parts of a result fit together.
| Part of the result | What to look at | What it tells you |
|---|---|---|
| Sign | Plus or minus in front of r | Direction: both rise together, or one falls as the other rises |
| Size | Distance of r from 0 | Strength of the linear relationship |
| p value | Significance test on r | Whether a relationship this size is plausible by chance alone |
| Scatterplot | Shape of the points | Whether the relationship is really linear and free of outliers |
Keep strength and significance apart. Akoglu (2018) reports an r of 0.31 between diastolic blood pressure and age with p below 0.0001, and still calls it weak: "A statistically significant correlation does not necessarily mean that the strength of the correlation is strong." With a large sample, even a small r becomes significant.
Reading a Pearson correlation coefficient
What each part of the result tells you
Part of the result
What it tells you
Sign of r
Direction: both rise together, or one falls as the other rises
Size of r, from 0 to 1
Strength of the linear relationship
p value
Whether a relationship this size is plausible by chance alone
Scatterplot
Whether the pattern is really linear and free of outliers
r squared
Share of variance the two variables have in common
Save this figure
◆ Question 3 / 8 · Is 0.7 strong?
Is 0.7 a strong Pearson correlation?
Direct answer: Usually yes, but the label depends on which convention you cite. Akoglu (2018) compares three published schemes: an r of 0.7 is "strong" for Dancey and Reidy in psychology, "very strong" for Quinnipiac University in political science, and only "moderate" for Chan in medicine.
An r of 0.7 therefore sits on a boundary: 2 of the 3 schemes call it strong or very strong, and 1 calls it moderate. That disagreement is the reason Akoglu's guide exists. In its own words, "The same strength of r is named differently by several researchers" (Akoglu, 2018, p. 91). The table copies part of Akoglu's comparison.
| r (positive or negative) | Dancey & Reidy (psychology) | Quinnipiac University (politics) | Chan (medicine) |
|---|---|---|---|
| 0.9 | Strong | Very strong | Very strong |
| 0.7 | Strong | Very strong | Moderate |
| 0.5 | Moderate | Strong | Fair |
| 0.3 | Weak | Moderate | Fair |
| 0.1 | Weak | Negligible | Poor |
Akoglu's comparison appeared in 2018 in volume 18 of the Turkish Journal of Emergency Medicine and covers Pearson, Spearman and Kendall coefficients. Cohen (1988) offers a fourth convention used widely in the social sciences, treating 0.10, 0.30 and 0.50 as small, medium and large effects. The practical rule for your dissertation is simple: choose one scheme, cite it in your methods chapter, and apply it consistently, so the marker can see the label comes from a source rather than from what you hoped to find.
◆ Question 4 / 8 · An r of 0.9
What does a Pearson correlation of 0.9 mean?
Direct answer: An r of 0.9 means the two variables follow a very tight straight-line pattern, and every scheme in Akoglu's (2018) table calls it strong or very strong. Squared, it means about 81% of the variation in one variable is shared with the other, which is unusually high for survey data.
Squaring 0.9 gives 0.81, so 81% of the variance is shared and 19% is not. A very high r deserves a second look before you celebrate. Check that the two measures are not near-duplicates, such as two versions of the same scale item, because an r close to 1 can signal redundancy rather than discovery. A near-perfect value is also worth checking for coding or data entry errors.
If you plan to put both variables into the same regression, a very high correlation between predictors also warns of multicollinearity. Our guide to effect sizes and confidence intervals explains how to report the uncertainty around a value like this.
◆ Question 5 / 8 · r and R squared
How is the Pearson correlation coefficient related to R²?
Direct answer: For two variables, squaring r gives the coefficient of determination, the share of variance the two variables have in common. An r of 0.5 squares to 0.25, so only a quarter of the variation is shared, while an r of 0.7 squares to 0.49, just under half.
Taking the 2 examples above, 0.5 times 0.5 is 0.25 and 0.7 times 0.7 is 0.49. Squaring makes the gap between "moderate" and "strong" easier to see. Moving from r = 0.3 to r = 0.6 doubles r but quadruples shared variance, from 9% to 36%. In simple linear regression with one predictor, the R² printed in the output is this same squared correlation, which is why some supervisors ask you to report both. When one variable is used to predict the other, the next step is simple linear regression explained for dissertation students.
Moving from r = 0.8 to r = 0.9 adds 17 percentage points of shared variance, from 64% to 81%. Remember that R² keeps the strength but drops the sign. A correlation of –0.7 and one of +0.7 both give an R² of 0.49, so state the direction in words whenever you quote R².
◆ Question 6 / 8 · Pearson or Spearman
When should you use Spearman correlation instead of Pearson?
Direct answer: Use Spearman's rank correlation when either variable is ordinal, clearly skewed, or affected by outliers. Pearson's r assumes continuous data from a roughly normal joint distribution, while Spearman works on ranks and measures any monotonic relationship (Schober et al., 2018; Mukaka, 2012).
| Feature | Pearson's r | Spearman's rho |
|---|---|---|
| Data type | Continuous (interval or ratio) | Ordinal, or continuous but skewed |
| Relationship measured | Linear | Monotonic (consistently rising or falling) |
| Sensitivity to outliers | High | Low, because it uses ranks |
| Typical student example | Revision hours and exam percentage | Likert items or ranked preferences |
Schober et al. (2018) published their tutorial in volume 126 of Anesthesia & Analgesia, and Mukaka (2012) shows why the choice matters: Pearson's coefficient is affected by extreme values, which may exaggerate or dampen the strength of a relationship. Akoglu (2018) adds that normality matters for the significance test and confidence interval rather than for calculating the coefficient itself. When the two coefficients disagree sharply on your data, report that and explain which one fits your variables.
◆ Question 7 / 8 · Reporting r
How do you report a Pearson correlation in a dissertation?
Direct answer: Report the coefficient with degrees of freedom and the p value, then name the direction and strength in words, for example: r(48) = .62, p < .001, a strong positive correlation. Degrees of freedom for Pearson's r are n minus 2, so 50 participants give 48.
In SPSS, IBM's statistics package, the test sits under Analyze, Correlate, Bivariate, and Kent State University Libraries (n.d.) walk through the dialog and the output matrix step by step. Before you paste the matrix into your results chapter, add the scatterplot, state which strength convention you used, and mention any checks for linearity and outliers. APA style drops the leading zero for r because it cannot exceed 1, and a p value below .001 is written as p < .001 rather than p = .000. With 50 participants and 48 degrees of freedom, the example r of .62 squares to about .38, or 38% shared variance.
A full sentence reads well in the results chapter: "Revision hours were positively correlated with exam score, r(48) = .62, p < .001, a strong correlation by Dancey and Reidy's conventions as summarised by Akoglu (2018)." The discussion chapter then interprets what that association might mean, without claiming cause.
◆ Question 8 / 8 · Getting a second check
Can MAAS help you check your correlation analysis?
Most students can run a correlation themselves, and doing it yourself is the best way to understand your own data. Where a second pair of eyes helps is in choosing between Pearson and Spearman, checking assumptions, and making sure the write-up matches the output. Through SPSS, R and Python data analysis support at MAAS, you work alongside a MAAS expert who explains each step of the analysis and reviews how you report it, with you making the decisions about your own project. Bring your research questions, your dataset and your university's reporting guidance to the first conversation.
Frequently asked questions
What is the range of the Pearson correlation coefficient?
Pearson's r runs from –1 to +1. A value of 0 means no linear relationship, and ±1 means all points lie exactly on a straight line (Mukaka, 2012).
What symbol is used for the Pearson correlation coefficient?
The sample coefficient is written r, and the population value is written with the Greek letter rho (Mukaka, 2012).
Is a negative Pearson correlation bad?
No. A negative r only means one variable tends to fall as the other rises. Strength depends on the size of r, not on its sign (Akoglu, 2018).
Does a significant correlation mean a strong correlation?
No. Akoglu (2018) shows an r of 0.31 with p below 0.0001 that is still weak, because large samples make small correlations significant.
What is the difference between Pearson's r and R squared?
R squared is r multiplied by itself and gives the share of variance two variables have in common, so r = 0.7 gives about 49%. R squared loses the sign, so always state the direction.
Should I use Pearson or Spearman for Likert scale data?
Single Likert items are ordinal, so Spearman is usually the safer choice. Summed scale scores are often treated as continuous, but check the distribution first.
References
Akoglu, H. (2018). User's guide to correlation coefficients. Turkish Journal of Emergency Medicine, 18(3), 91–93. https://doi.org/10.1016/j.tjem.2018.08.001
Anscombe, F. J. (1973). Graphs in statistical analysis. The American Statistician, 27(1), 17–21. https://doi.org/10.1080/00031305.1973.10478966
Cohen, J. (1988). Statistical power analysis for the behavioral sciences (2nd ed.). Lawrence Erlbaum Associates.
Kent State University Libraries. (n.d.). SPSS tutorials: Pearson correlation. https://libguides.library.kent.edu/SPSS/PearsonCorr
Mukaka, M. M. (2012). A guide to appropriate use of correlation coefficient in medical research. Malawi Medical Journal, 24(3), 69–71. https://pmc.ncbi.nlm.nih.gov/articles/PMC3576830/
Schober, P., Boer, C., & Schwarte, L. A. (2018). Correlation coefficients: Appropriate use and interpretation. Anesthesia & Analgesia, 126(5), 1763–1768. https://doi.org/10.1213/ANE.0000000000002864
Not sure how this guide applies to your own case? Talk it through with MAAS in a free 20-minute consultation.
Book a free consultation ▸