
◆ Research Methods
How do you run and report a paired t test in APA 7?
A paired t test compares two measurements taken on the same people, such as scores before and after a module, and asks whether the average change differs from zero. This guide covers what the test tells you, how it differs from an independent t test, the formula, the SPSS route, a worked example, the APA 7 write-up and the nonparametric fallback.
Most statistics guides, including Kent State University Libraries (n.d.) and Shier (2004), teach the test the same way: reduce each pair to one difference score, then test those differences. Everything below follows that logic, using one worked example from the Mathematics Learning Support Centre. For the wider question of when to pick this test at all, see our guide to choosing the right statistical test, and for effect sizes in general read how to report effect size and confidence intervals.
◆ Question 1 / 10 · What it tells you
What does a paired t test tell you?
Direct answer: A paired t test tells you whether the mean difference between two related measurements is likely to be zero in the population. Kent State University Libraries (n.d.) describe it as comparing two measurements from the same individual, object or related units, such as pre and post scores or the left and right ear.
The test goes by several names. Kent State University Libraries (n.d.) list dependent t test, paired t test and repeated measures t test, and JMP Statistical Discovery (n.d.) adds matched pairs and paired-difference. The name matters when you search for help, but the procedure is the same one in every case.
A significant result says the average change is unlikely to be exactly zero. It does not say the change is large. Shier (2004) makes this point in the worked example used later in this guide: with 20 students the increase is statistically significant but relatively small. That is why the effect size and confidence interval belong in the write-up next to the p value.
◆ Question 2 / 10 · Paired vs unpaired
What is the difference between a paired and an unpaired t test?
Direct answer: A paired t test analyses one sample measured twice, so each score has a partner. An unpaired (independent samples) t test compares two separate groups with no pairing. Kent State University Libraries (n.d.) say the paired test is not appropriate for unpaired data, and point to the independent samples t test instead.
Pairing is a property of your design, not of your software. If the same participant, or a deliberately matched participant, supplies one score to each condition, the pairs are related and the test must respect that. The 2-sample t test treats every score as coming from a different person, so it ignores the link between the two scores and throws away information.
| Feature | Paired t test | Independent (2-sample) t test |
|---|---|---|
| Design | Same units measured twice, or matched pairs | Two separate groups |
| Data layout in SPSS | Two columns, one row per pair | One test column and one grouping column |
| What is tested | Mean of the difference scores | Difference between two group means |
| Degrees of freedom | n - 1, where n is the number of pairs | Depends on group sizes |
| Normality is checked on | The difference scores | Each group's scores |
| Rank-based alternative | Wilcoxon signed-rank test | Mann-Whitney U test |
Paired and independent t tests compared
Design, data layout, and what is tested
Paired t test
Independent (2-sample) t test
Same units measured twice, or matched pairs
Two separate groups
Two columns, one row per pair
One test column and one grouping column
Mean of the difference scores is tested
Difference between two group means is tested
Degrees of freedom are n - 1
Degrees of freedom depend on group sizes
Normality is checked on the difference scores
Normality is checked on each group's scores
Save this figure
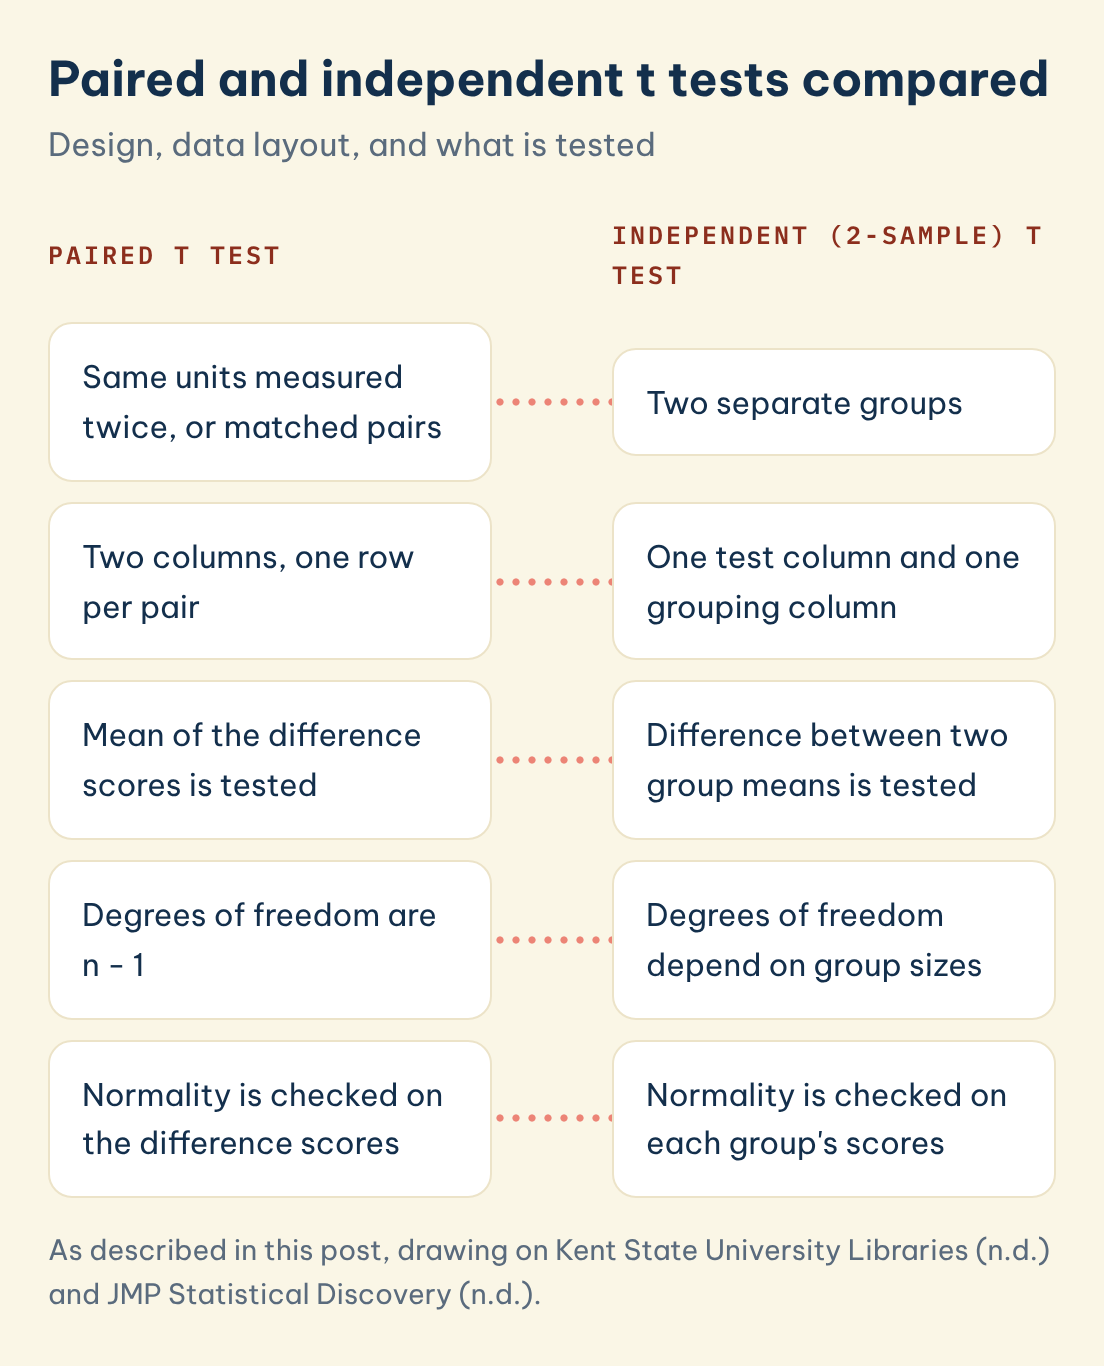
The table follows Kent State University Libraries (n.d.) and JMP Statistical Discovery (n.d.). Notice the last two rows: the assumption check changes with the design, and so does the fallback test.
◆ Question 3 / 10 · One or two tails
How do you know if a test is one-tailed or two-tailed?
Direct answer: Decide before you look at the data. A two-tailed test asks whether the mean difference is different from zero in either direction, and it is the usual default. A one-tailed test asks about one direction only, for example whether scores rose, and needs a directional hypothesis written down in advance.
Recent SPSS versions print both one-sided and two-sided p; use the one-sided value only if your hypothesis named a direction beforehand. Choosing the tail after seeing which way the data fell is not a legitimate use of the test. If your supervisor or journal has no strong view, report the two-tailed result. Kent State University Libraries (n.d.) note that the confidence interval percentage you choose does not change the p value, so the tail decision is separate from the interval you report.
◆ Question 4 / 10 · Assumptions
What are the assumptions of a paired t test?
Direct answer: The pairs must be independent of each other, the sample should be random, each pair must come from the same subject or matched set, and the differences must be approximately normal without extreme outliers (JMP Statistical Discovery, n.d.). Kent State University Libraries (n.d.) add a continuous outcome measured in two variables.
The detail that most students miss is where to check normality. Kent State University Libraries (n.d.) put it plainly: "When testing assumptions related to normality and outliers, you must use a variable that represents the difference between the paired values - not the original variables themselves."
In practice, compute a new variable (after minus before) and draw a histogram or Q-Q plot of it. Shier (2004) notes that for the test to be valid the differences only need to be approximately normally distributed, and that it is not advisable with extreme outliers. JMP Statistical Discovery (n.d.) adds that with small samples you may not be able to test normality at all, in which case you rely on your understanding of the measure or move to a nonparametric test.
◆ Question 5 / 10 · Formula
What is the paired t test formula?
Direct answer: The test statistic is t = mean difference divided by (s_diff / the square root of n), with degrees of freedom df = n - 1 (Kent State University Libraries, n.d.). Here s_diff is the standard deviation of the difference scores and n is the number of pairs, not the number of observations.
Written out, the denominator s_diff / sqrt(n) is the standard error of the mean difference. A large t means the observed mean difference is many standard errors away from zero. With n pairs, you look t up against a t distribution with n - 1 degrees of freedom, which is why a study of 20 pairs reports df = 19.
The same ingredients give the confidence interval: mean difference plus or minus t* times the standard error, where t* is the critical value for your chosen confidence level and the same df. Nothing else is needed, which is also why Lakens (2013) observes that the t value and the number of pairs are enough to allow a power analysis.
◆ Question 6 / 10 · Worked example
What does a worked paired t test example look like?
Direct answer: Shier (2004) tests 20 students before and after a module. The mean difference is 2.05 and the standard deviation of the differences is 2.837, giving a standard error of 0.634, t = 3.231 on 19 degrees of freedom, p = 0.004, and a 95% confidence interval for the mean difference of 0.72 to 3.38.
You can rebuild every number from the first two. The standard error is 2.837 divided by the square root of 20, which is 0.634. Then t = 2.05 / 0.634 = 3.231. Shier (2004) uses a critical value t* of 2.093 for 19 df, so the 95% interval is 2.05 plus or minus 2.093 x 0.634, which gives 0.72 to 3.38.
| Quantity | Value from Shier (2004) |
|---|---|
| Number of pairs, n | 20 |
| Mean difference | 2.05 |
| SD of differences | 2.837 |
| Standard error | 0.634 |
| t | 3.231 |
| df | 19 |
| p (two-sided) | 0.004 |
| 95% CI for mean difference | 0.72 to 3.38 |
| Critical value t* | 2.093 |
Because the interval does not include zero, it agrees with the significant p value. Shier (2004) also notes the increase is statistically significant but relatively small, so a sensible write-up reports both facts rather than only "significant".
◆ Question 7 / 10 · Running it in SPSS
How do you run a paired t test in SPSS?
Direct answer: Put the two measurements in two columns, one row per pair, then choose Analyze > Compare Means and Proportions > Paired-Samples T Test (Kent State University Libraries, n.d.). Move both variables into the pair box, tick the option to estimate effect sizes if you want Cohen's d, and run.
Before the test, create the difference variable and check it for normality and outliers, as described in the assumptions section. Kent State University Libraries (n.d.) explain that the effect size option adds Cohen's d and a Hedges' corrected estimate, and that you choose which standard deviation estimate is used as the standardiser. Read the output in this order:
- The descriptive table, to see the two means and standard deviations.
- The test table, for the mean difference, its standard deviation and standard error, the confidence interval of the difference, t, df and the two-sided significance.
- The effect size table, if you requested it, and check which standardiser it used.
Older SPSS versions label the menu Analyze > Compare Means > Paired-Samples T Test, so look for the same words if your menu differs. If you are stuck on the data layout or on reading the output for a dissertation chapter, data analysis guidance from MAAS can help you understand the output while you run and write up the analysis yourself.
◆ Question 8 / 10 · Reporting in APA 7
How do you interpret and report a paired t test in APA 7?
Direct answer: An APA 7 write-up of a paired t test gives t with its degrees of freedom in brackets, an exact p value, the mean difference and a 95% confidence interval. Round t to two decimals and drop the leading zero from p, following the APA numbers and statistics guide (American Psychological Association, 2024).
The APA Style numbers and statistics guide asks for inferential statistics such as t to two decimals, and for exact p to two or three decimals, using p < .001 when the value is smaller (American Psychological Association, 2024). It also drops the leading zero for statistics that cannot exceed 1, such as p, and keeps it for those that can, such as d.
| Element | APA 7 rule | Example |
|---|---|---|
| Symbols | Italicise t, p, M, SD | t, p |
| Spacing | Spaces around operators | p = .004 |
| t value | Two decimals | 3.23 |
| p value | Exact, no leading zero; below .001 write p < .001 | .004 |
| Effect size such as d | Leading zero kept, because d can exceed 1 | 0.72 |
| Confidence interval | State the level, then limits in square brackets | 95% CI [0.72, 3.38] |
| Defining terms | Do not define M, SD, t, df or p; do define CI |
Here is a model sentence built from the Shier (2004) numbers: "Scores increased significantly after the module, t(19) = 3.23, p = .004, mean difference = 2.05, 95% CI [0.72, 3.38], dz = 0.72." Add the two means and standard deviations in the sentence or a table, but do not repeat the same statistics in both, which the APA guide also advises (American Psychological Association, 2024).
Interpretation follows the same order: say whether there is a statistically significant change, say in which direction and by how much, then comment on whether that size matters for your field. If you want the formatting done for you, the builder in our effect size and confidence interval guide turns printed numbers into a ready sentence.
◆ Question 9 / 10 · dz or dav
Which effect size should you report: dz or dav?
Direct answer: Cohen's dz divides the mean difference by the standard deviation of the differences, while dav divides it by the average of the two conditions' standard deviations (Lakens, 2013). For the Shier (2004) numbers, dz = 2.05 / 2.837, which is about 0.72, calculated here from the figures in the example.
Lakens (2013) explains why dz is the one software often asks for: "Given the direct relationship between the t-value of a paired-samples t-test and Cohen's dz, it will not be surprising that software that performs power analyses for within-subjects designs ... relies on Cohen's dz as input." (Lakens, 2013, p. 4)
Lakens (2013) recommends reporting Cohen's drm or dav, with Hedges' correction, when effect sizes will be compared across studies, and presents dz mainly as the input for power analysis. The two measures can differ: when the correlation between the two measurements is above .50, dz is larger than dav, and when it is below .50, dz is smaller. The Shier (2004) example gives no per-condition standard deviations, so dz is shown here only because dav cannot be computed from the numbers available. If you have real data, report dav or drm, name the one you report, and print t and the number of pairs, which are enough for readers to run an a priori power analysis (Lakens, 2013).
◆ Question 10 / 10 · Wilcoxon fallback
When should you use the Wilcoxon signed-rank test instead?
Direct answer: Use the Wilcoxon signed-rank test when the paired differences are clearly not normal, when extreme outliers are present, or when the outcome is ordinal rather than continuous. Kent State University Libraries (n.d.) name it as the alternative for non-normal or ranked paired data, so it is the natural fallback for the same design.
The paired t test is not appropriate for an ordinal outcome, a non-normal difference distribution, more than two related measurements, or unpaired data (Kent State University Libraries, n.d.). For more than two related measurements, use a repeated-measures ANOVA; for more than two independent groups, ANOVA. The Wilcoxon test works on ranks of the differences rather than on their raw size, so it trades some power for fewer assumptions. Report it with its own statistic and p value rather than forcing t into the sentence.
Frequently asked questions
What does a paired t-test tell you?
A paired t test tells you whether the average difference between two related measurements, such as before and after scores from the same people, differs from zero (Kent State University Libraries, n.d.).
What is the difference between a paired and unpaired t-test?
A paired test uses the same or matched units measured twice, while an unpaired test compares two separate groups. Using the unpaired test on paired data ignores the link between scores (Kent State University Libraries, n.d.).
How many degrees of freedom does a paired t test have?
The degrees of freedom are n - 1, where n is the number of pairs (Kent State University Libraries, n.d.). Shier (2004) has 20 students and therefore 19 df.
What is the difference between a 2 sample t-test and a paired t-test?
The 2-sample test compares independent groups and checks normality in each group. The paired test reduces each pair to a difference and checks normality of those differences (Kent State University Libraries, n.d.).
How do I report a paired t test in APA 7?
Give t with df in brackets, the exact p value, the mean difference and a 95% CI, for example t(19) = 3.23, p = .004, 95% CI [0.72, 3.38], dz = 0.72, where dz is computed here from the example's numbers (American Psychological Association, 2024).
Do I report dz or dav?
Lakens (2013) recommends dav or drm for comparing across studies, and dz mainly for power analysis, so say which one you computed. dz uses the standard deviation of the differences and dav uses the average of the two standard deviations (Lakens, 2013).
What if my differences are not normal?
Move to the Wilcoxon signed-rank test, which Kent State University Libraries (n.d.) recommend for non-normal or ranked paired data.
References
American Psychological Association. (2024). APA Style numbers and statistics guide. https://apastyle.apa.org/instructional-aids/numbers-statistics-guide.pdf
JMP Statistical Discovery. (n.d.). The paired t-test. https://www.jmp.com/en/statistics-knowledge-portal/t-test/paired-t-test
Kent State University Libraries. (n.d.). SPSS tutorials: Paired samples t test. https://libguides.library.kent.edu/SPSS/PairedSamplestTest
Lakens, D. (2013). Calculating and reporting effect sizes to facilitate cumulative science: A practical primer for t-tests and ANOVAs. Frontiers in Psychology, 4, Article 863. https://doi.org/10.3389/fpsyg.2013.00863
Shier, R. (2004). Statistics: 1.1 Paired t-tests. Mathematics Learning Support Centre. https://www.statstutor.ac.uk/resources/uploaded/paired-t-test.pdf
Tools & resources
Not sure how this guide applies to your own case? Talk it through with MAAS in a free 20-minute consultation.
Book a free consultation ▸