
◆ Research Methods
How do you use a Net Promoter Score survey in research?
Direct answer: A Net Promoter Score survey asks one recommendation question on a 0 to 10 scale and reports promoters minus detractors. In research, treat it as a single-item instrument: state the exact wording, report the full distribution with a margin of error, and avoid commercial benchmarks (Bain & Company, n.d.; Rocks, 2016).
◆ Question 1 / 8 · What is a net promoter
What is a net promoter survey?
Direct answer: A net promoter survey is a short questionnaire built around a single recommendation question that respondents answer on a scale from 0 to 10. Bain & Company (n.d.) sorts the answers into 3 groups, and the final score is the gap between the two outer groups.
The method comes from customer-loyalty work, and students meet it in survey chapters on student experience, service quality or patient experience. Bain & Company (n.d.) puts promoters at 9 to 10, passives at 7 to 8 and detractors at 0 to 6. Passives count in the sample size but not in the subtraction. Because the score is the gap between two percentages, it runs from -100 to +100, and a result of +25 simply means that promoters outnumber detractors by 25 percentage points. For a dissertation the important point is that the score is a summary of one question. It tells you how the respondents split, and it does not tell you why. That is why many NPS surveys add an open follow-up question such as "What is the main reason for your score?", which gives you material for thematic coding and keeps the number from standing alone.
◆ Question 2 / 8 · What are the net promoter
What are the net promoter survey questions?
Direct answer: The core item is the single recommendation question, scored 0 to 10, and an optional open question asks for the reason. In research, name the object being rated (a module, a clinic, a programme) and keep the wording identical for every respondent so that the scores can be compared and replicated.
Bain & Company (n.d.) gives the standard form as "How likely are you to recommend us to a friend or colleague?" Research use needs two adjustments. First, replace "us" with the specific object, for example "this module" or "this clinic", so that respondents are not guessing what you mean. Second, report the wording verbatim in your methods chapter, including the anchors at 0 and 10, because a reader cannot judge a score without seeing the question. Kara and Zeren (2023) applied the idea to students at a state university and ran an online survey that compared NPS groups with ANOVA and path analysis. A single item is not automatically weak. Bergkvist and Rossiter (2007) found no difference in predictive validity between single-item and multiple-item measures of the same constructs, but they limited that finding to constructs with a concrete singular object and a concrete attribute. Say that explicitly if you defend the item, and do not claim the paper validates NPS itself.
◆ Question 3 / 8 · How do you calculate a Net
How do you calculate a Net Promoter Score? A worked example
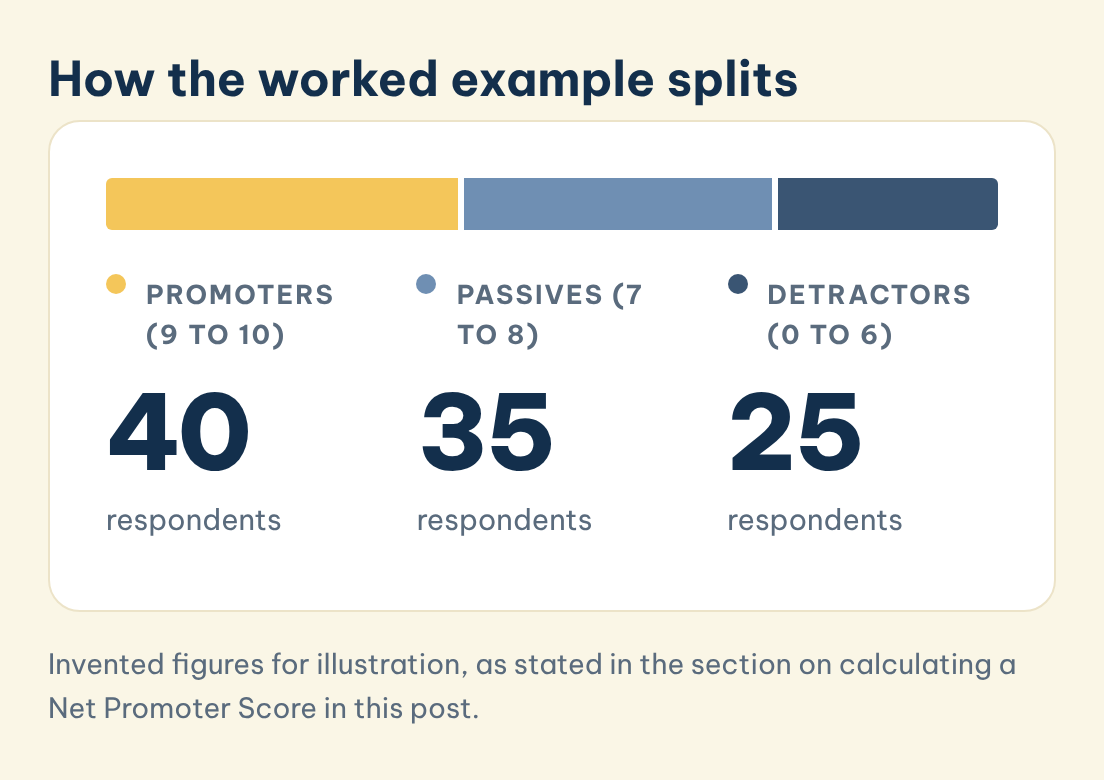
Direct answer: Count the respondents in each group, convert them to percentages, and subtract the detractor percentage from the promoter percentage. With 100 respondents of whom 40 score 9 or 10, 35 score 7 or 8 and 25 score 0 to 6, the NPS is 40 - 25 = +15.
The table below uses those numbers. They are invented for illustration, so they are not data from a real study. The same example is carried through the rest of this guide.
| Group | Scores | Respondents | Share |
|---|---|---|---|
| Promoters | 9 to 10 | 40 | 40% |
| Passives | 7 to 8 | 35 | 35% |
| Detractors | 0 to 6 | 25 | 25% |
| Total | 0 to 10 | 100 | NPS = +15 |
How the worked example splits
Illustrative sample of 100 respondents, not real data.
Promoters (9 to 10)
40
respondents
Passives (7 to 8)
35
respondents
Detractors (0 to 6)
25
respondents
Save this figure
Bain & Company (n.d.) explains why the scale has 11 points: it avoids confusion at "1" and avoids respondents defaulting to "five out of five". When you present the result, write the calculation out in one sentence, for example "40% promoters minus 25% detractors gives an NPS of +15", so a marker can reproduce it. The calculation also shows what is lost. Rocks (2016) points out that the score collapses 11 answer categories into 3, so a sample made entirely of passives and a sample split half and half between promoters and detractors both produce an NPS of 0 even though they describe very different groups.
◆ Question 4 / 8 · What is the Net Promoter
What is the Net Promoter Score scale, and can you use 5 points?
Direct answer: The standard Net Promoter Score scale runs from 0 to 10. A 5-point version is not standard, so if you use one you must define your own cut-offs and avoid comparing your result with published 0 to 10 scores. Bain & Company (n.d.) defines only the 11-point form.
Bain & Company (n.d.) defines the 0 to 10 form and its cut-offs, and every published NPS that uses those cut-offs is comparable only with others that do the same. A 5-point version is a different instrument. There is no agreed rule for turning 5 categories into 3 groups, and one plausible rule (5 as promoter, 4 as passive, 1 to 3 as detractor) is only a convention that I am proposing, not a source-backed standard. The safest choices for a student are these:
- Keep 0 to 10 if you want to compare with other NPS studies.
- Change the scale only for a clear reason, such as a questionnaire where every other item is on 5 points, and then state your mapping before collecting data.
- Do not benchmark a modified NPS against published ones, and say so as a limitation.
Whichever route you take, record the decision in your methods chapter. A departure from the standard form that you explain and justify is far easier to defend in a viva than one that appears unexplained.
◆ Question 5 / 8 · Is 25 a good NPS score?
Is 25 a good NPS score? And what is a good Net Promoter Score?
Direct answer: A score of 25 is positive, because promoters outnumber detractors, but whether it is good depends on the comparison group. Commercial guides publish "good", "excellent" and "world-class" bands, yet those describe companies, not a student sample, so a dissertation should compare against its own baseline or a comparable cohort.
The same logic answers the question of whether 70 is a good NPS score: it is a high number on a scale that ends at +100, but a number on its own is not evidence of anything. Adams et al. (2022) reviewed 12 healthcare studies and concluded that many of the proposed benefits of NPS are not supported by research. They also report that scores vary by age, condition and culture, so caution is needed when using NPS for comparisons. Kara and Zeren (2023) found a substantial divergence between the NPS of a business programme and that of the whole university, and they note that their method does not support generalisation. Put together, these studies point to the same practical advice: compare like with like, for example this year's cohort against last year's cohort at the same institution, and describe your sample so the reader knows who is being compared.
◆ Question 6 / 8 · Does a Net Promoter Score
Does a Net Promoter Score work as a research measure?
Direct answer: The evidence is mixed. Keiningham et al. (2007) did not replicate the claim that NPS is the best predictor of growth, Baehre et al. (2022) found that only one version predicted sales, and Adams et al. (2022) advise using it alongside a larger survey. As a research variable it is acceptable only if you acknowledge these limits.
The original claim was commercial: that this one number predicts company growth. Keiningham et al. (2007) tested it on 21 firms using more than 15,500 interviews and wrote: "We find no support for the claim that Net Promoter is the 'single most reliable indicator of a company's ability to grow'" (Keiningham et al., 2007, p. 45). Baehre et al. (2022) followed 7 sportswear brands over 5 years and concluded that the original premise is reasonable and the methodological concerns raised by academics are valid, with only the brand-health NPS, taken from all potential customers, predicting later sales growth. Both studies test sales in firms, so neither tells you whether NPS is a valid measure of satisfaction in a student sample. The healthcare review points the same way: Adams et al. (2022) say that NPS may not be sufficient as a stand-alone metric and may be better used with a larger survey. In a dissertation that means pairing the NPS item with other questions or with open-text answers, and describing it as a summary indicator and not as proof of loyalty. The wider question of how the survey fits your overall design is covered in our guide to research methodology.
◆ Question 7 / 8 · How do you analyse
How do you analyse and report NPS in a dissertation?
Direct answer: Report the counts and percentages for all 3 groups, the NPS, the sample size and a margin of error. Rocks (2016) gives the variance as p(promoters) + p(detractors) - (p(promoters) - p(detractors))^2, and the interval as the NPS plus or minus z times the square root of the variance divided by n.
Apply that formula to the worked example, where the shares are .40 and .25. The variance is .40 + .25 - (.15)^2 = .6275. The standard error is the square root of .6275 / 100, about .079, or 7.9 points. At 95% confidence, z = 1.96, so the margin of error is about 15.5 points and the interval runs from roughly 0 to 31. A score of +15 from 100 respondents is therefore consistent with an NPS near zero, which is a good reason to report the interval and not only the point estimate. The same formula shows how large a sample you would need: keeping the same distribution, a margin of 5 points calls for about 965 respondents (my calculation from Rocks' formula). Our guide to calculating sample size for a research study explains the wider logic of planning n.
For comparing two groups, Lewis and Sauro (2021) describe an adjusted procedure that adds a small constant to the counts and divides the gap in scores by the standard error of the difference. Their worked example shows a 33-point difference between two products with p = .07, which is a reminder that a big gap in NPS can still be uncertain when n is small. Because the 0 to 10 item is ordinal, which is my reasoning from how the scale is built and not a point taken from a cited source, avoid reporting a mean without also showing the distribution. A table of counts, as in the example above, does the job.
A short reporting checklist for the methods and results chapters:
- Methods: the exact question, the scale and anchors, the cut-offs, the sampling frame, the response rate.
- Results: counts and percentages for the 3 groups, the NPS with its interval, and any open-text themes.
- Discussion: the limits listed by Keiningham et al. (2007) and Adams et al. (2022), and why you do or do not compare with outside figures.
◆ Question 8 / 8 · How can MAAS help you
How can MAAS help you with survey data and analysis?
Direct answer: MAAS works as a tutor and advisor. An expert can talk through your questionnaire wording, the choice between the 0 to 10 and 5-point forms, and how to present the interval, while the questionnaire, the analysis and the writing stay yours. The first conversation is free.
If you are designing a survey and are unsure whether a single recommendation item suits your research question, research data collection support from MAAS offers a place to test the idea before you collect responses. An advisor can check your wording against your research question, point you to the reading your discipline expects, and review the way you report the distribution and margin of error. A typical session compares your draft items with the aim of the study, asks who the respondents are and how many you can realistically reach, and suggests what to put in the limitations section. The advisor guides and reviews, and you design the instrument and write up the results yourself.
Frequently asked questions
What is a net promoter survey in research?
It is a questionnaire built around one recommendation question scored from 0 to 10. Bain & Company (n.d.) defines the score as the percentage of promoters (9 to 10) minus the percentage of detractors (0 to 6). In research you report the exact wording and the full distribution.
How do I calculate NPS from my responses?
Convert the counts to percentages and subtract. With 40 promoters, 35 passives and 25 detractors out of 100 respondents, the NPS is 40 - 25 = +15. Passives are in the sample size but not in the subtraction.
Can I use a 5-point scale for NPS?
You can, but it is non-standard. Bain & Company (n.d.) defines the 0 to 10 form, so a 5-point version needs your own stated cut-offs and should not be compared with published scores.
Is an NPS of 25 or 70 good?
Both are positive, since promoters outnumber detractors, but neither is good or bad without a comparison group. Adams et al. (2022) advise caution when comparing scores across groups, so compare your cohort with a similar one.
Is NPS valid for student research?
The evidence is limited. Keiningham et al. (2007) did not replicate the growth claim, and Adams et al. (2022) say it may be better used with a larger survey. Treat it as one summary indicator and say so in your limitations.
How do I report the uncertainty in an NPS?
Use the variance formula in Rocks (2016) to compute a margin of error and report the interval with the score. In the worked example, +15 from 100 respondents has a margin of about 15.5 points.
References
Adams, C., Walpola, R. L., Schembri, A. M., & Harrison, R. (2022). The ultimate question? Evaluating the use of Net Promoter Score in healthcare: A systematic review. Health Expectations, 25(5), 2328-2339. https://doi.org/10.1111/hex.13577
Baehre, S., O'Dwyer, M., O'Malley, L., & Lee, N. (2022). The use of Net Promoter Score (NPS) to predict sales growth: Insights from an empirical investigation. Journal of the Academy of Marketing Science, 50(1), 67-84. https://doi.org/10.1007/s11747-021-00790-2
Bain & Company. (n.d.). Measuring your Net Promoter Score. Net Promoter System. https://www.netpromotersystem.com/about/measuring-your-net-promoter-score/
Bergkvist, L., & Rossiter, J. R. (2007). The predictive validity of multiple-item versus single-item measures of the same constructs. Journal of Marketing Research, 44(2), 175-184. https://doi.org/10.1509/jmkr.44.2.175
Kara, A., & Zeren, D. (2023). The relationship between the Net Promoter Score (NPS) and students' college experiences at a state university. International Review on Public and Nonprofit Marketing, 20(4), 721-737. https://doi.org/10.1007/s12208-022-00352-4
Keiningham, T. L., Cooil, B., Andreassen, T. W., & Aksoy, L. (2007). A longitudinal examination of Net Promoter and firm revenue growth. Journal of Marketing, 71(3), 39-51. https://doi.org/10.1509/jmkg.71.3.039
Lewis, J. R., & Sauro, J. (2021, February 2). How to statistically compare two Net Promoter Scores. MeasuringU. https://measuringu.com/nps-significance-test/
Rocks, B. (2016). Interval estimation for the 'Net Promoter Score' [Preprint]. arXiv. https://arxiv.org/abs/1601.07235
Not sure how this guide applies to your own case? Talk it through with MAAS in a free 20-minute consultation.
Book a free consultation ▸