
◆ Research Methods
What is multicollinearity and how do you check it with VIF?
Multicollinearity means that two or more predictors in a regression carry overlapping information, so the model cannot separate their effects. The variance inflation factor (VIF) measures how much that overlap inflates the variance of a coefficient. Kim (2019) treats a VIF above 5 to 10 as a sign that multicollinearity exists, though the cut-off is a convention, not a law.
◆ Question 1 / 9 · What are VIF and tolerance
What are VIF and tolerance, and how are they calculated?
Direct answer: VIF and tolerance both come from regressing one predictor on all the other predictors. If that regression has an R-squared of R²j, then tolerance is 1 minus R²j and VIF is 1 divided by tolerance. A VIF of 1 means the predictor shares nothing with the rest.
From R-squared to tolerance and VIF
Three values of R-squared for one predictor regressed on the others.
R-squared of predictor j on the others
Tolerance and VIF
0.50
Tolerance 0.50, VIF 2
0.80
Tolerance 0.20, VIF 5
0.90
Tolerance 0.10, VIF 10
Save this figure
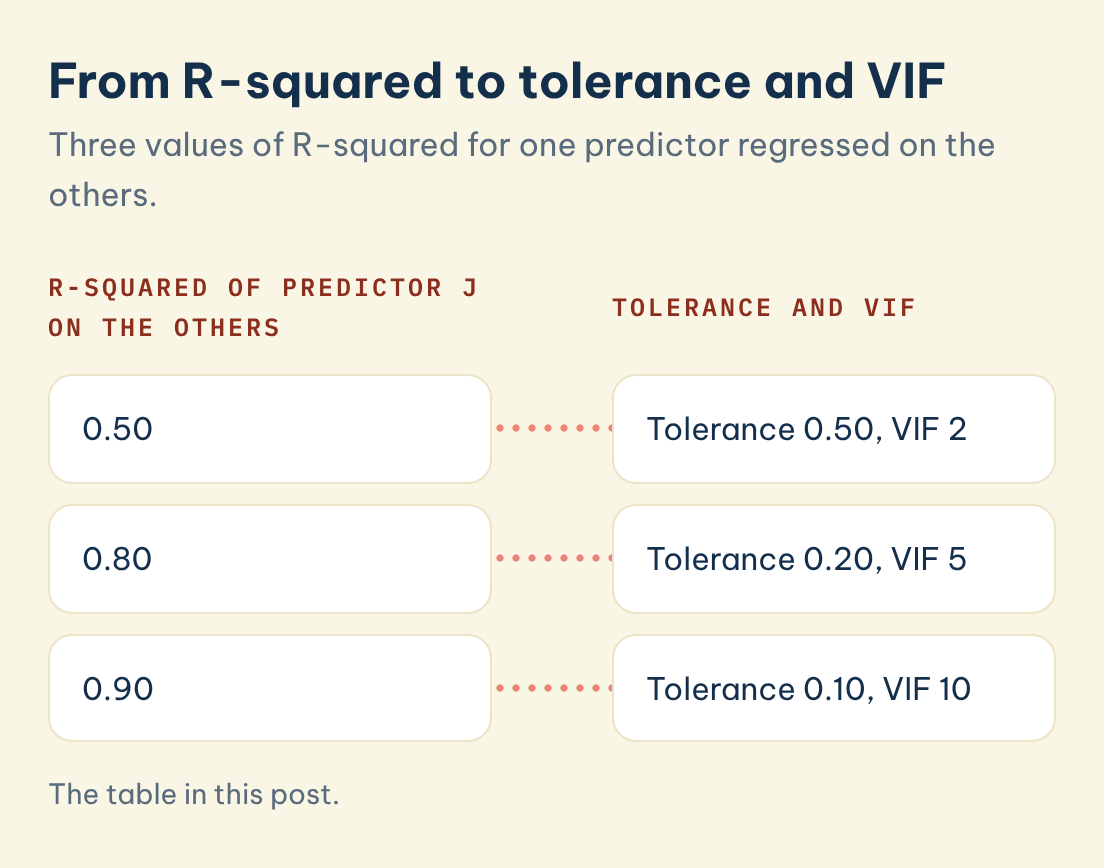
Penn State Eberly College of Science (n.d.) defines the variance inflation factor for the jth predictor as VIF_j = 1/(1 − R_j²), where R_j² is the R-squared obtained by regressing that predictor on the remaining predictors. A VIF of 1 means there is no correlation between the jth predictor and the others, so the variance of its coefficient is not inflated at all. Kim (2019) describes tolerance as the reciprocal of the VIF, which is the same quantity as 1 − R².
Because the calculation uses all the other predictors at once, VIF can pick up a dependence among three or more variables that a table of pairwise correlations would not show. The arithmetic is easy to check by hand, and the table below turns three values of R²j into tolerance and VIF.
| R² of predictor j on the others | Tolerance (1 − R²j) | VIF (1 ÷ tolerance) |
|---|---|---|
| 0.50 | 0.50 | 2 |
| 0.80 | 0.20 | 5 |
| 0.90 | 0.10 | 10 |
The last two rows matter because they are the usual cut-offs. Kim (2019) places the VIF threshold at 5 to 10 and the tolerance threshold at 0.1 to 0.2, which corresponds to an R² of 0.8 to 0.9.
◆ Question 2 / 9 · How do you get VIF
How do you get VIF and tolerance in SPSS?
Direct answer: In SPSS, open Analyze, then Regression, then Linear, click Statistics and tick Collinearity diagnostics. SPSS then adds Tolerance and VIF columns to the Coefficients table. University of California, Los Angeles OARC Stats (n.d.) gives the same instruction for the Statistics dialog.
The steps are short. Enter your outcome as the dependent variable and all your predictors as independent variables, exactly as you would for the main model, then open the Statistics dialog and tick the box. Run the regression and read the Coefficients table, where each predictor now has its own tolerance and VIF. The Analyze menu path is standard SPSS; the instruction to open Linear Regression, choose Statistics and check Collinearity diagnostics is the one University of California, Los Angeles OARC Stats (n.d.) states.
Read the output predictor by predictor. University of California, Los Angeles OARC Stats (n.d.) explains that tolerance is the share of a predictor's variance that the other predictors cannot account for, so very small values mean the predictor is redundant. Its worked example is a model where several parent-education variables measured the same thing, and it reports VIFs of 2434.887 and 2099.164 with a tolerance of .000. A pair of numbers like that is a prompt to rethink the variable set, not to tweak a setting.
◆ Question 3 / 9 · What VIF value counts as too
What VIF value counts as too high?
Direct answer: There is no single agreed cut-off. Sources use 4, 5 or 10 as the point where you should look harder, and tolerance below 0.1 or 0.2 as the matching signal. Treat the number as a flag for investigation, not a pass or fail verdict on your model.
The table sets out what each source says, so you can cite the one your department prefers.
| Source | VIF threshold | Tolerance threshold |
|---|---|---|
| Kim (2019, p. 559) | Greater than 5 to 10 | Lower than 0.1 to 0.2 |
| Penn State Eberly College of Science (n.d.) | Above 4 warrants investigation; above 10 is serious | Not stated in the passage used |
| University of California, Los Angeles OARC Stats (n.d.) | Greater than 10 is problematic | Below 0.10 is worrisome |
| CCSR, University of Manchester (n.d.) | Greater than 10 may be a problem | Not stated in the passage used |
The spread between 4 and 10 is why reviewers sometimes disagree. If your handbook or supervisor names a cut-off, use it and say so in the write-up. If none is named, state the threshold you chose and cite one of the sources above, so the reader can see that the choice was made before the interpretation, not after.
◆ Question 4 / 9 · What problems does
What problems does multicollinearity cause?
Direct answer: It inflates the standard errors of the affected coefficients, which widens their confidence intervals and makes the estimates unstable. A coefficient can swing when you add or drop a variable, or even take the opposite sign to what theory predicts.
The most direct statement comes from University of California, Los Angeles OARC Stats (n.d.): as multicollinearity increases, the coefficient estimates become unstable and the standard errors can get wildly inflated. Kim (2019, p. 559) puts the same point in terms of intervals: "The increase in the standard error leads to a wide 95% confidence interval of the regression coefficient." A wide interval is what turns a predictor that matters in theory into one that is "not significant" in your table.
CCSR, University of Manchester (n.d.) lists the symptoms a student is likely to see. Standard errors are large, coefficients change a lot when variables are added or deleted, and a coefficient can come out in the opposite direction to your expectation, such as a negative sign where you expected a positive relationship. These symptoms are the reason to check VIF before interpreting any individual coefficient.
Kim also adds a limit on what VIF can do: "Although the variance inflation factor helps to determine the presence of multicollinearity, it cannot detect the explanatory variables causing the multicollinearity" (Kim, 2019, p. 559). You still have to look at which predictors overlap in meaning.
◆ Question 5 / 9 · When is a high VIF nothing
When is a high VIF nothing to worry about?
Direct answer: When the coefficient you care about is not one of the collinear ones, or when the overlap is built in, as with an interaction term and its main effects. O'Brien (2007) argues that VIF cut-offs must be judged in context, not applied mechanically.
O'Brien (2007) opens with the problem: several rules of thumb, "most commonly the rule of 10", are regarded by many practitioners as a sign of severe multicollinearity. His abstract states that VIF values of 10, 20, 40 or even higher "do not, by themselves, discount the results of regression analyses", and that threshold values need to be evaluated alongside the other factors that influence the variance of regression coefficients. In practice, many supervisors will be more concerned when the collinear predictors are the variables your hypotheses are about than when they are control variables.
A second case is the product term. Olvera Astivia and Kroc (2019) describe the common view that product-interaction terms are highly correlated with their main effects. That correlation is built into how the term is made, so a large VIF on those rows is expected and says little about the quality of your model. Dummy variables coded from one categorical predictor can show a similar pattern, so check with your supervisor before treating their VIFs as a problem.
◆ Question 6 / 9 · Does mean centring reduce
Does mean centring reduce multicollinearity?
Direct answer: Not always. Centring helps interpretation, and it can help when a product term is involved, but Olvera Astivia and Kroc (2019) show that it does not reliably reduce multicollinearity and sometimes increases it. Shieh (2011) adds that the interaction test itself stays unchanged.
Many textbooks recommend subtracting the mean from each predictor before forming an interaction. Olvera Astivia and Kroc (2019) report that mean centring is recommended both to simplify the interpretation of coefficients and to reduce multicollinearity, and then test the second claim. Their conclusion is that the implication that centring always reduces multicollinearity is incorrect, and that in many cases centring will greatly increase the problem. They still treat it as a viable tool "only in certain cases".
Shieh (2011) reaches a compatible result from a different angle. Depending on the characteristics of the data, mean centring can either increase or decrease various measures of multicollinearity, and the resulting test statistic remains unchanged regardless. The practical lesson for a dissertation is to centre for a reason you can state, usually easier interpretation, and not to promise your examiner that centring has removed a VIF problem. Check the VIF again after centring and report what you see.
◆ Question 7 / 9 · How can you reduce
How can you reduce multicollinearity?
Direct answer: Combine overlapping variables into one, drop a redundant variable with a stated reason, reduce dimensions with principal component analysis, or use ridge regression. Each option has a cost, so pick the one that fits your research question and justify it.
Kim (2019, p. 561) notes that combining variables into a higher hierarchical variable can reduce multicollinearity. For example, three survey items measuring the same attitude can be averaged into a scale, as long as the items belong together conceptually. CCSR, University of Manchester (n.d.) calls removing the offending variable the simplest method, and suggests that variables can be reduced in dimensionality using a technique such as principal component analysis.
Dropping variables carries a warning. Kim (2019, p. 561) states that excluding relevant variables produces biased coefficients, "leading to issues more serious than multicollinearity", and names ridge regression as an alternative that keeps all the variables in the model. O'Brien (2007) goes further and says that high VIFs do not by themselves call for eliminating variables, using ridge regression or combining variables into an index. Read together, the sources say the same thing: first ask whether the collinearity actually harms the coefficient you need, and only then pick a remedy.
◆ Question 8 / 9 · How do you report VIF
How do you report VIF in a dissertation?
Direct answer: State the diagnostic, the threshold you used with its source, the range of VIF values, and what you did if any value crossed the line. Put the full table in an appendix if you have many predictors, and mention it in the main text.
A short methods sentence is usually enough, for example: "Multicollinearity was assessed with the variance inflation factor, using a cut-off of 10 (University of California, Los Angeles OARC Stats, n.d.); all VIF values were below this threshold." Replace the cut-off with the one your department uses and with your real values. If a predictor exceeded the threshold, say which one, what you did about it (combined, dropped, kept with a justification) and how the results changed.
Reporting the minimum and maximum VIF also helps a reader judge the model quickly, and a table with tolerance and VIF for each predictor makes the check reproducible. Keep the claims modest. A VIF below your threshold supports the model but does not prove that the coefficients are right, and a VIF above it is a reason to look closer, not an automatic reason to discard the variable.
◆ Question 9 / 9 · How can MAAS help with VIF
How can MAAS help with VIF and regression diagnostics?
Direct answer: MAAS works as a tutor and advisor. An MAAS expert goes through your model, your SPSS output and your reasoning with you, explaining each diagnostic and why it matters, while the analysis, the writing, the interpretation and the submission all remain yours throughout.
If you are unsure whether a high VIF in your own output is a problem, data analysis support for SPSS, R and Python from MAAS lets you talk it through with a MAAS expert alongside you. The most useful things to bring are the Coefficients table, your research question and your department's guidance on thresholds. For choosing the model before diagnostics, our guide on how to choose the right statistical test is the place to start, and what statistics help covers and what stays your own work explains the boundary. The first conversation is free.
Frequently asked questions
What does a VIF of 1.5 mean?
Using the formula VIF = 1/(1 − R²), a VIF of 1.5 means the other predictors explain about 33% of the variance in that predictor (R² of 0.33). The variance of its coefficient is 1.5 times what it would be with no overlap, which is low by every threshold in the table above.
What is a good VIF score?
A VIF of 1 means no overlap with the other predictors. Kim (2019) treats values greater than 5 to 10 as a sign that multicollinearity exists, so values well below 5 are generally unproblematic.
Is a VIF of 10 always a problem?
No. O'Brien (2007) states that VIF values of 10, 20, 40 or higher do not, by themselves, discount the results of regression analyses, and that thresholds need to be judged in context.
What is the difference between tolerance and VIF?
They carry the same information. Tolerance is 1 minus R²j, and VIF is its reciprocal, so a tolerance of 0.1 corresponds to a VIF of 10.
Which variable is causing the multicollinearity?
VIF alone cannot tell you. Kim (2019, p. 559) states that it cannot detect the explanatory variables causing the multicollinearity, so inspect which predictors measure similar things.
Does centring my variables fix a high VIF?
Not reliably. Olvera Astivia and Kroc (2019) found that centring does not always reduce multicollinearity and can increase it, so recheck VIF after centring.
Can I just delete one of the correlated variables?
Sometimes, with a stated reason. Kim (2019, p. 561) warns that excluding relevant variables produces biased coefficients, which can be a more serious issue than multicollinearity.
References
CCSR, University of Manchester. (n.d.). Multiple regression [Working paper]. https://hummedia.manchester.ac.uk/institutes/cmist/archive-publications/working-papers/2020/multiple-linear-regression.pdf
Kim, J. H. (2019). Multicollinearity and misleading statistical results. Korean Journal of Anesthesiology, 72(6), 558-569. https://doi.org/10.4097/kja.19087
O'Brien, R. M. (2007). A caution regarding rules of thumb for variance inflation factors. Quality & Quantity, 41(5), 673-690. https://doi.org/10.1007/s11135-006-9018-6
Olvera Astivia, O. L., & Kroc, E. (2019). Centering in multiple regression does not always reduce multicollinearity: How to tell when your estimates will not benefit from centering. Educational and Psychological Measurement, 79(5), 813-826. https://doi.org/10.1177/0013164418817801
Penn State Eberly College of Science. (n.d.). 10.7 Detecting multicollinearity using variance inflation factors [Course notes, STAT 462]. https://online.stat.psu.edu/stat462/node/180/
Shieh, G. (2011). Clarifying the role of mean centring in multicollinearity of interaction effects. British Journal of Mathematical and Statistical Psychology, 64(3), 462-477. https://doi.org/10.1111/j.2044-8317.2010.02002.x
University of California, Los Angeles OARC Stats. (n.d.). Introduction to regression with SPSS, lesson 2: Regression diagnostics. https://stats.oarc.ucla.edu/spss/seminars/introduction-to-regression-with-spss/introreg-lesson2/
Tools & resources
- UCLA OARC Stats: regression diagnostics in SPSS (UCLA Advanced Research Computing)
Not sure how this guide applies to your own case? Talk it through with MAAS in a free 20-minute consultation.
Book a free consultation ▸