
◆ Research Methods
When should you use a Kruskal-Wallis test instead of ANOVA?
The Kruskal-Wallis test compares three or more independent groups by ranking every observation and asking whether the groups' ranks differ more than chance would allow. Students reach for it when a one-way ANOVA is shaky because the outcome is ordinal, such as a Likert rating, or because small groups are badly skewed.
◆ Question 1 / 8 · Uses
What is a Kruskal-Wallis test used for?
Direct answer: The Kruskal-Wallis test checks whether three or more independent groups come from the same distribution, using ranks instead of raw scores. Nahm (2016) describes it as a nonparametric way to analyse variance that asks whether the median values of the groups differ (given similar group shapes), which makes it the rank-based counterpart of a one-way ANOVA.
A typical dissertation case is a survey that compares satisfaction ratings from first-year, second-year and final-year students, where each student belongs to one group only. The ratings are ordered categories, not true measurements, so a mean of 3.4 on a five-point scale is hard to defend. Kruskal and Wallis (1952) built the test by pooling every observation, ranking them from 1 to the total sample size, giving tied values the mean of their ranks, and summing the ranks within each group. If one group consistently holds the higher ranks, its rank sum grows and the test statistic, H, grows with it. The R Core Team (n.d.) states the null hypothesis in general terms: the location parameters of the distribution are the same in each group, and the alternative is that at least one differs. With two groups only, the same logic gives the Mann-Whitney U test.
◆ Question 2 / 8 · ANOVA vs Kruskal-Wallis
What is the difference between an ANOVA and a Kruskal-Wallis test?
Direct answer: A one-way ANOVA compares group means on raw scores and assumes roughly normal residuals with similar variances. The Kruskal-Wallis test compares groups on ranks, so it drops the normality assumption and tolerates outliers (Nahm, 2016). The price is that it answers a looser question, about distributions or medians, rather than a precise question about means.
| Feature | One-way ANOVA | Kruskal-Wallis test |
|---|---|---|
| Data used | Raw scores | Ranks of the pooled scores |
| Outcome level | Interval or ratio | Ordinal, interval or ratio |
| Normality assumed | Yes, for residuals | No |
| Test statistic | F | H, compared with chi-square on k − 1 df |
| Follow-up test | Tukey, Games-Howell | Dunn's test with an adjusted p |
| Effect size | η² or ω² | ε²R or η²H |
One-way ANOVA and the Kruskal-Wallis test, feature by feature
Each row sets what ANOVA uses beside what the rank test uses instead.
One-way ANOVA
Kruskal-Wallis test
Raw scores
Ranks of the pooled scores
Interval or ratio outcome
Ordinal, interval or ratio outcome
Normal residuals assumed
No normality assumed
F statistic
H, compared with chi-square on k minus 1 df
Tukey or Games-Howell follow-up
Dunn's test with an adjusted p
Save this figure
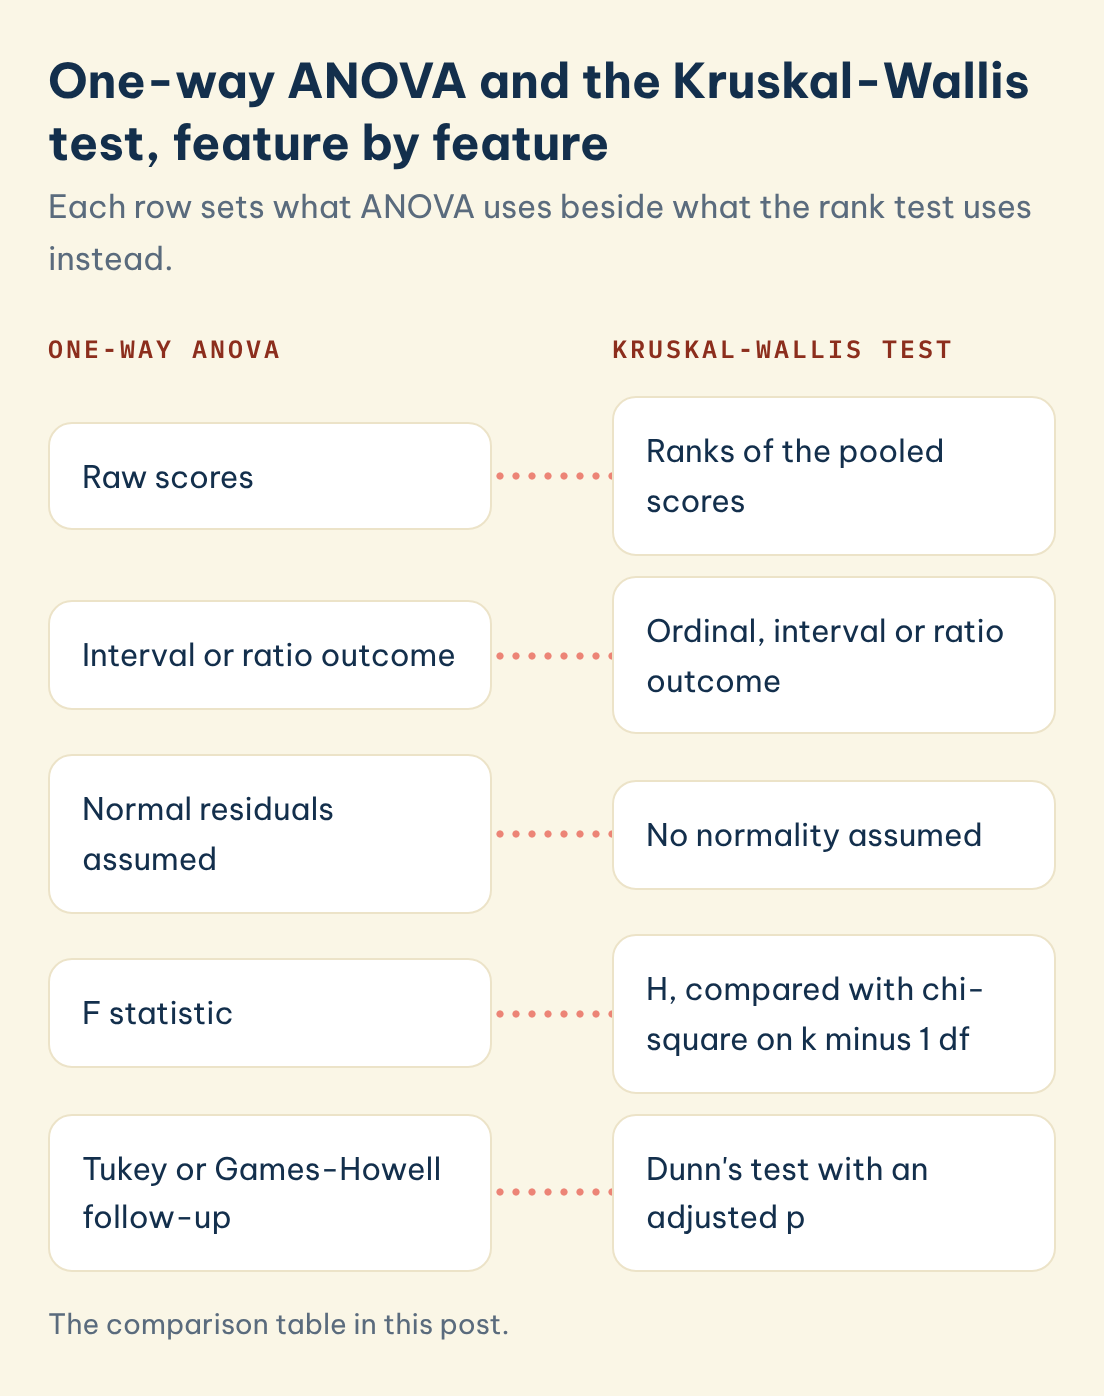
Choosing the rank test is not a free upgrade. When the ANOVA assumptions hold, ANOVA uses more of the information in your data, so most supervisors expect you to justify the switch in one sentence of your methods chapter, for example by pointing to a clearly skewed histogram, an outlier you cannot remove, or a Likert outcome. If your data are fine for ANOVA, run the one-way ANOVA instead.
◆ Question 3 / 8 · Assumptions
What assumptions does the Kruskal-Wallis test make?
Direct answer: The groups must be independent, each person must appear in one group only, and the outcome must be at least ordinal. To read a significant result as a difference in medians, the group distributions also need a similar shape. A common rule asks for at least five observations in each group.
Independence is the assumption students break most often without noticing. Kruskal and Wallis (1952) framed the test for separate samples, and the statstutor guide from the University of Sheffield lists independent observations first, followed by similar sample sizes and more than five data points per sample (Marshall & Patel, 2015), slightly stricter than the rule below. SciPy's documentation gives the same rule of thumb that "each sample must have at least 5 measurements" (SciPy developers, n.d.), because below that size the chi-square approximation for H becomes unreliable.
The shape condition matters for interpretation rather than for running the test. In their original paper, Kruskal and Wallis (1952) wrote that "one may often assume that the populations are of approximately the same form, in the sense that if they differ it is by a shift or translation" (p. 584). When the groups have that same shape, a significant H can fairly be reported as a difference in medians. When one group is skewed left and another skewed right, the test still detects that the distributions differ, but the word "median" in your results sentence overstates what you have shown. Plotting a boxplot or histogram for each group before you write is the quickest way to check.
◆ Question 4 / 8 · Interpreting results
How do you interpret Kruskal-Wallis test results?
Direct answer: Read the H statistic, its degrees of freedom (number of groups minus one) and the p-value. A p below your alpha, usually .05, means at least one group differs from another. The test does not say which groups differ, so a significant result needs pairwise follow-up tests before you can name them.
Software output often lists a mean rank for each group next to H. Mean ranks tell you the direction of the difference: the group with the highest mean rank tends to have the higher scores. They are not medians, so report the medians or interquartile ranges from your descriptive table as well. The SciPy developers (n.d.) put the limit plainly: "rejecting the null hypothesis does not indicate which of the groups differs."
The usual follow-up is Dunn's (1964) procedure, which compares pairs of groups using the same pooled ranks as the omnibus test. Because you run several comparisons, each p-value must be adjusted to keep the overall error rate at your chosen alpha. With three groups there are 3 pairwise comparisons, so a Bonferroni split of .05 tests each pair at about .0167; with four groups there are 6 pairs and each is tested at about .0083. Dunn (1964) noted that splitting alpha across the comparisons "is a conservative choice in order to obtain a 1 − α overall level" (p. 248). This Bonferroni-style correction is, according to the statstutor guide, "the standard adjustment made after the Kruskall-Wallis" (Marshall & Patel, 2015, p. 18), and in SPSS it appears as the "Adj. Sig." column of the pairwise table, which is already adjusted, so you compare it with .05 directly.
◆ Question 5 / 8 · Formula and effect size
What is the Kruskal-Wallis test formula, and how is effect size calculated?
Direct answer: The test statistic is H = [12 / (N(N + 1))] × Σ(Rj² / nj) − 3(N + 1), where N is the total sample, Rj the rank sum and nj the size of group j. Effect size is often reported as epsilon-squared, H divided by (N² − 1)/(N + 1).
Take three groups of 10 students, so N = 30: the constant 12 / (30 × 31) is about 0.0129, the subtracted term 3 × 31 is 93, and the degrees of freedom are 3 − 1 = 2. At .05 with 2 degrees of freedom, the chi-square critical value is 5.99. Kruskal and Wallis (1952) showed that H is distributed approximately as chi-square with k − 1 degrees of freedom unless the samples are very small, which is why software reports a chi-square p-value.
A p-value says nothing about size, so pair it with an effect size. Tomczak and Tomczak (2014) give the epsilon-squared estimate as E²R = H / [(n² − 1)/(n + 1)], with values running from 0, no relationship, to 1, a perfect relationship. The same paper gives an eta-squared version, η²H = (H − k + 1)/(n − k), for k groups. The paper does not fix small, medium or large cut-offs for these measures, so describe the size against studies in your own field rather than borrowing labels. Our guide to reporting effect size and confidence intervals explains why the number matters more than the label.
◆ Question 6 / 8 · APA 7 reporting
How do you report a Kruskal-Wallis test in APA 7?
Direct answer: A common convention is to give the H statistic with its degrees of freedom in brackets, the exact p-value and an effect size, then report the adjusted pairwise results with medians for each group. APA 7 does not prescribe a single template, so check your department handbook.
Here is a worked sentence with illustrative numbers, not data from a real study: "Satisfaction differed across the three year groups (N = 95), H(2) = 8.41, p = .015, ε² = .09. Dunn's pairwise tests with Bonferroni adjustment showed that final-year students (Mdn = 4) rated satisfaction higher than first-year students (Mdn = 3), p = .012, while no other pair differed." Write H and p in italics, give p to two or three decimals with no zero before the point, and write p < .001 rather than p = .000.
◆ Question 7 / 8 · SPSS, R and Python
How do you run a Kruskal-Wallis test in SPSS, R and Python?
Direct answer: In SPSS use Analyze, Nonparametric Tests, Independent Samples, then request pairwise comparisons. In R call kruskal.test(score ~ group, data = df) (R Core Team, n.d.). In Python call scipy.stats.kruskal() with one array per group (SciPy developers, n.d.). All three return H and a p-value; post hoc tests need an extra step in R and Python.
| Software | Omnibus test | Pairwise follow-up |
|---|---|---|
| SPSS | Nonparametric Tests, Independent Samples | Pairwise comparisons in the model viewer, "Adj. Sig." column |
| R | kruskal.test() in the stats package |
A Dunn test from an add-on package |
| Python | scipy.stats.kruskal() |
A Dunn test from an add-on library |
The R Core Team (n.d.) notes that kruskal.test returns the statistic, the degrees of freedom of the approximate chi-squared distribution, and the p-value. SciPy's function returns the statistic "corrected for ties" (SciPy developers, n.d.), which matters for Likert data where many answers share a value. State the software and version in your methods section. If the analysis itself is the part you are unsure about, data analysis support from MAAS coaches you through choosing the test, running it and interpreting the output, while the analysis and the write-up stay yours.
◆ Question 8 / 8 · Kruskal-Wallis vs Friedman
What is the difference between the Kruskal-Wallis and Friedman tests?
Direct answer: Use Kruskal-Wallis when each participant belongs to one group only, and the Friedman test when the same participants are measured three or more times or under three or more conditions. Friedman is the rank-based counterpart of a repeated-measures ANOVA, just as Kruskal-Wallis is the counterpart of a one-way ANOVA.
The choice follows your design, not your data. If you surveyed different students in each year group, the groups are independent and Kruskal-Wallis fits. If you asked the same students to rate three teaching formats, every person contributes to every condition, the scores are linked, and running Kruskal-Wallis would break its independence assumption. For two related measurements, the paired version is the Wilcoxon signed-rank test.
Frequently asked questions
Is the Kruskal-Wallis test a test of medians?
Only when the group distributions have a similar shape. Kruskal and Wallis (1952) assumed populations of approximately the same form, differing by a shift, and under that condition a significant result can be read as a difference in medians.
Can I use Kruskal-Wallis for Likert scale data?
Yes, it is a common choice for a single Likert item compared across three or more independent groups, because the test only uses the order of the answers. Ties are frequent, so use software that applies the tie correction.
What sample size do I need for a Kruskal-Wallis test?
A common rule of thumb is at least five observations per group, the figure SciPy's documentation gives (SciPy developers, n.d.). Smaller groups make the chi-square approximation unreliable, and some software then offers an exact test.
What post hoc test follows a significant Kruskal-Wallis result?
Dunn's test (Dunn, 1964), which compares pairs of groups on the pooled ranks, with an adjustment such as Bonferroni for the number of comparisons. Report the adjusted p-values.
Can I use Kruskal-Wallis with only two groups?
You can, and the result is equivalent to a Mann-Whitney U test (the p differs slightly if a continuity correction is applied), but most supervisors expect you to report the Mann-Whitney U test for two groups because it is the conventional choice.
What effect size should I report?
Epsilon-squared, H divided by (n² − 1)/(n + 1), as set out by Tomczak and Tomczak (2014), or their eta-squared version. Interpret the size against your own field.
Related guides
- How do you choose the right statistical test?: match the test to your design
- Data analysis support: SPSS, R and Python guidance
References
Dunn, O. J. (1964). Multiple comparisons using rank sums. Technometrics, 6(3), 241–252. https://doi.org/10.1080/00401706.1964.10490181
Kruskal, W. H., & Wallis, W. A. (1952). Use of ranks in one-criterion variance analysis. Journal of the American Statistical Association, 47(260), 583–621. https://doi.org/10.1080/01621459.1952.10483441
Marshall, E., & Patel, C. (2015). The statistics tutor's quick guide to commonly used statistical tests. statstutor, University of Sheffield. https://statstutor.ac.uk/resources/uploaded/tutorsquickguidetostatistics.pdf
Nahm, F. S. (2016). Nonparametric statistical tests for the continuous data: The basic concept and the practical use. Korean Journal of Anesthesiology, 69(1), 8–14. https://doi.org/10.4097/kjae.2016.69.1.8
R Core Team. (n.d.). kruskal.test: Kruskal-Wallis rank sum test. The R Stats Package. https://stat.ethz.ch/R-manual/R-devel/library/stats/html/kruskal.test.html
SciPy developers. (n.d.). scipy.stats.kruskal. SciPy documentation. https://docs.scipy.org/doc/scipy/reference/generated/scipy.stats.kruskal.html
Tomczak, M., & Tomczak, E. (2014). The need to report effect size estimates revisited: An overview of some recommended measures of effect size. Trends in Sport Sciences, 21(1), 19–25. https://www.wbc.poznan.pl/Content/325867/PDF/5_Trends_Vol21_2014_%20no1_20.pdf
Not sure how this guide applies to your own case? Talk it through with MAAS in a free 20-minute consultation.
Book a free consultation ▸