
◆ Research Methods
Fisher's exact test vs chi-square: which for small samples?
Fisher's exact test and the chi-square test both ask whether two categorical variables are related, but they calculate the p-value in different ways. Chi-square relies on a large-sample approximation, while Fisher's test calculates an exact probability, which is why it is the usual choice when a table has very few cases.
The sections below explain when each test is appropriate, shows a small worked example where the two give different answers, and walks through SPSS and APA reporting. For the basics of the chi-square test itself, see our guide to the chi-square table and test, and for the wider choice between test families see parametric vs non-parametric tests.
◆ Question 1 / 7 · What it is used for
What is Fisher's exact test used for?
Direct answer: Fisher's exact test checks whether two categorical variables are associated in a contingency table. It calculates an exact p-value from the hypergeometric distribution instead of the chi-square approximation, and it is mathematically valid for any sample size, although it matters most for small samples (Madadizadeh et al., 2026).
Madadizadeh et al. (2026) describe the test in a tutorial written for medical researchers, and the framing carries over to student projects. They write that "Fisher's exact test is primarily recommended for the analysis of 2 x 2 contingency tables when sample sizes are small or when expected cell counts are less than five in one or more cells" (Madadizadeh et al., 2026, p. 201). The same paragraph adds that the test is generally unnecessary in large samples, (Madadizadeh et al., 2026). As general statistical knowledge, the reason is that the chi-square result and the exact result converge as the counts grow.
Kim (2017) makes a related point for clinical researchers. Fisher's test is practically applied only to small samples, but it is valid for all sample sizes, so choosing it does not invalidate the result. Software now does the arithmetic, which means a small table is the only place where the choice really matters for your marks.
◆ Question 2 / 7 · Versus chi-square
What is the difference between chi-square and Fisher's exact test?
Direct answer: Use Fisher's exact test when the expected counts are too small for chi-square. The usual guideline says chi-square is unreliable when more than 20% of cells have an expected count below 5. Check expected counts, not observed counts (Kim, 2017).
Fisher's exact p
.080
two-sided, for the 12-student illustration in this post
Pearson chi-square p
.021
same table, every expected count equal to 3
Choosing between chi-square and Fisher's exact test
Tap a step to see what it does.
Step 1 / 3
Request expected counts
In SPSS Crosstabs, tick Expected in the Cells dialog and read the expected count of every cell.
Step 2 / 3
Apply the 20% rule
If more than 20% of cells have an expected count below 5, the chi-square approximation is not reliable.
Step 3 / 3
Use the exact test
Report Fisher's exact test for a 2 x 2 table, or the Fisher-Freeman-Halton test for a larger table, with the exact p-value.
Save this figure
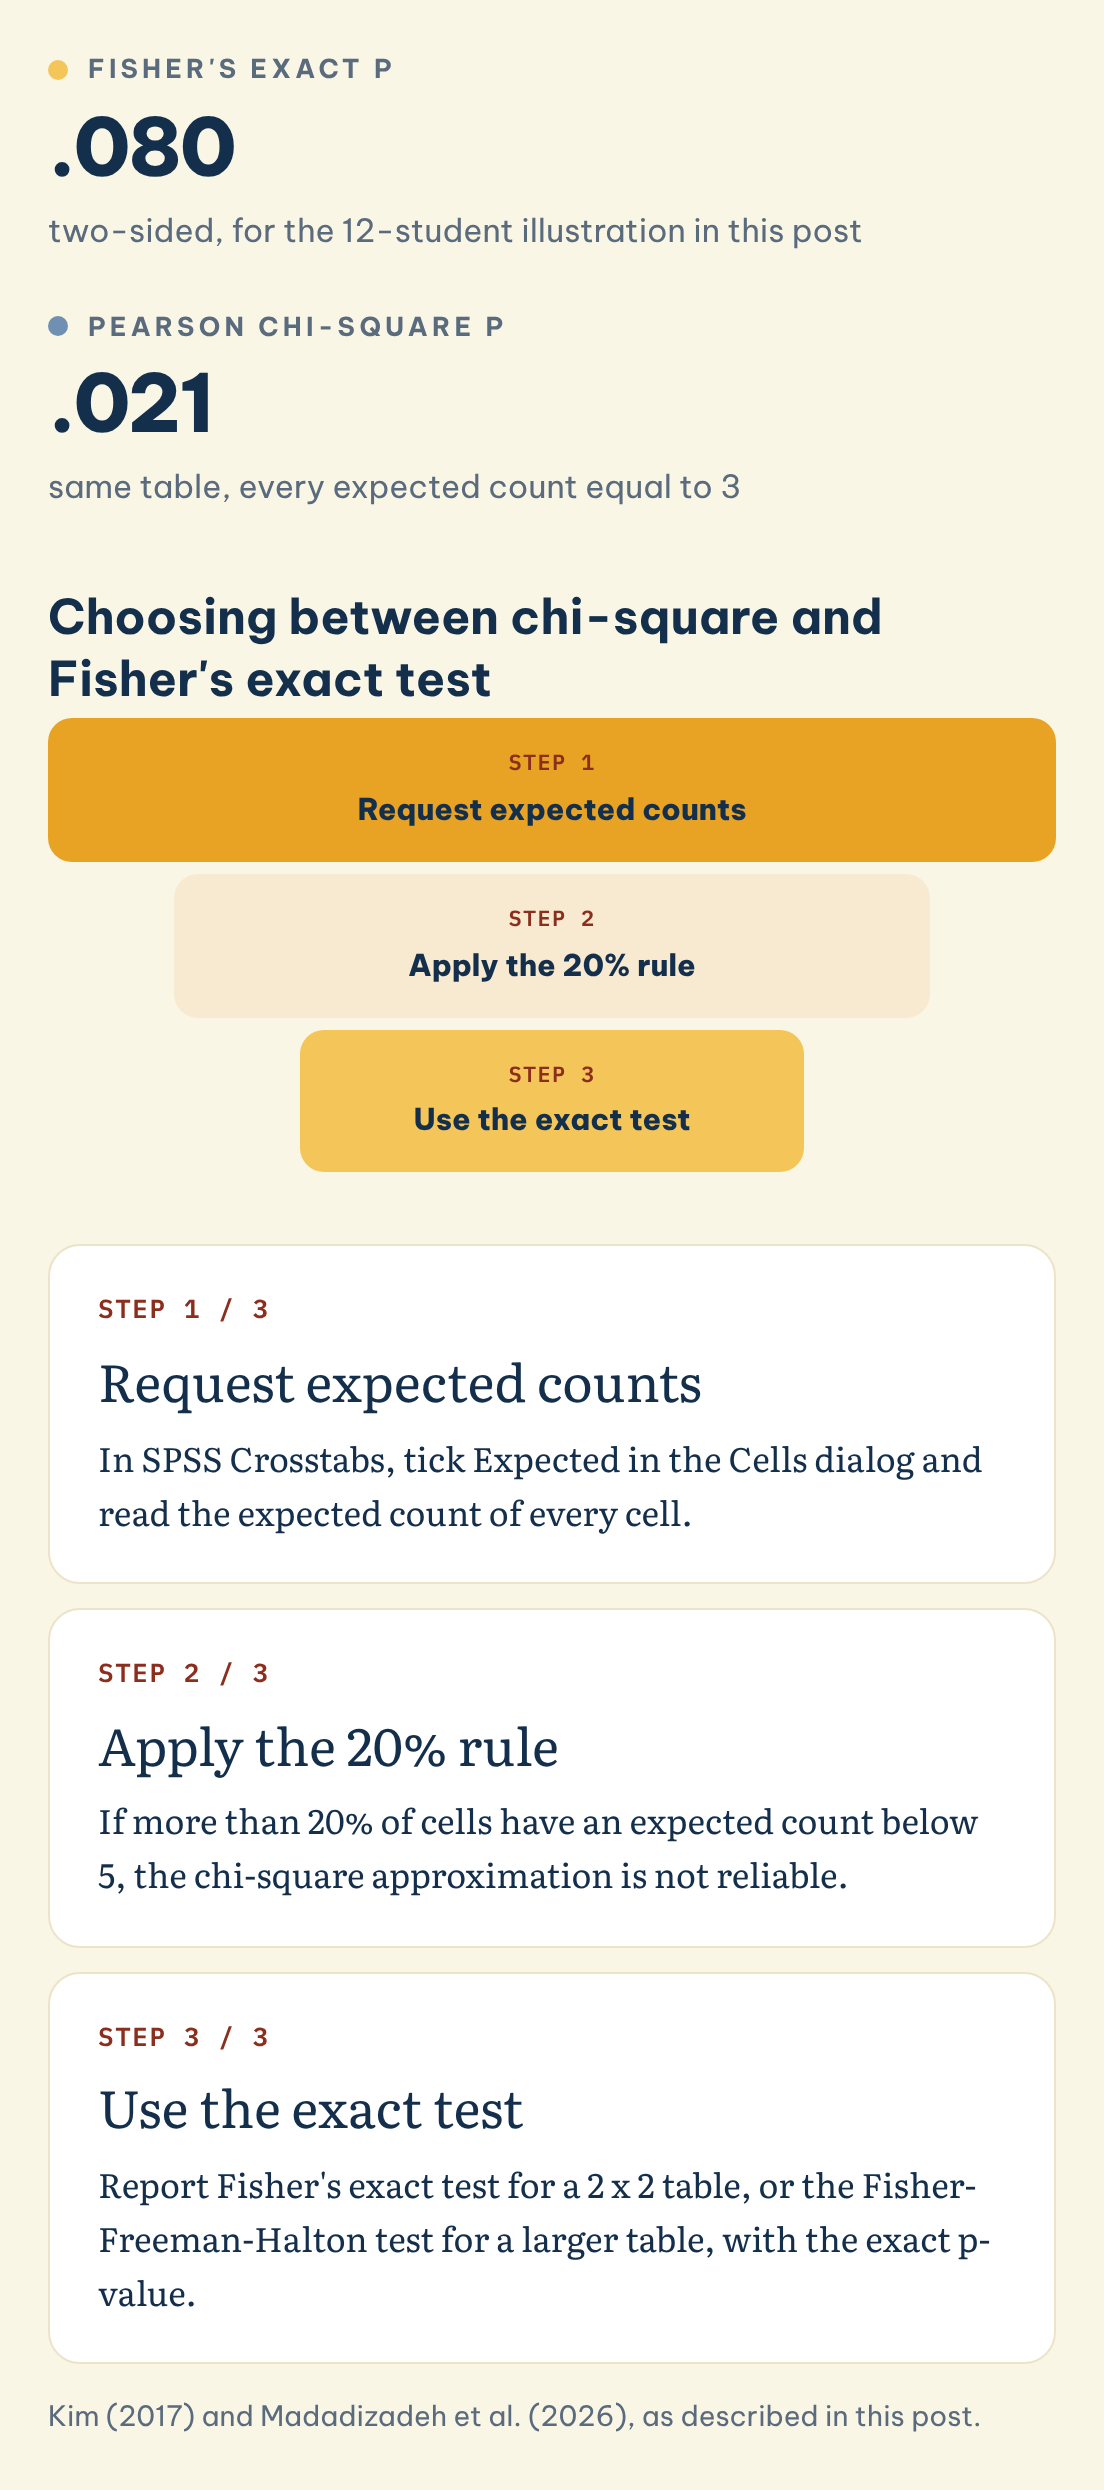
Kim (2017) gives the practical version of the guideline: the chi-square result is relevant only when no more than 20% of cells have expected frequencies below 5, and when more than 20% do, Fisher's exact test is the one to use. Madadizadeh et al. (2026, p. 203) list the same general guideline in their comparison table, with chi-square requiring all expected counts of at least 5. Many university guides also add that no expected count should fall below 1.
Students often check the wrong numbers. Grace-Martin (n.d.) points out that the assumption concerns the expected value in each cell, not the observed count, so a cell showing 2 observed cases is not automatically a problem if its expected count is higher. Ask SPSS to print the expected counts under Cells in the Crosstabs dialog, then count how many fall below 5 and compare that share with the 20% limit.
Not everyone agrees that you should switch tests after looking at your data. Neuhäuser and Ruxton (2025) note that several rules of thumb for what counts as "small" exist, and that choosing between the two tests based on the obtained data is unusual. They point out that Pearson's chi-square can also be run as an exact test for any sample size, and they recommend routinely using an exact test regardless of the obtained data, with the choice prespecified. For a dissertation, the safest habit is to decide your test in the methods section before you see the results, and to explain the reason there.
◆ Question 3 / 7 · How to solve it
How do you solve Fisher's exact test?
Direct answer: The test treats the row and column totals as fixed, then asks how likely your table is among all tables that could produce those totals. The p-value adds the probability of the observed table to that of every table at least as unlikely, using the hypergeometric formula (Madadizadeh et al., 2026).
Madadizadeh et al. (2026, p. 202) explain that Fisher's test "computes an exact p-value conditional on the fixed margins ... whereas the chi-square test relies on a large-sample approximation." Later they state the rule behind the sum: "The p-value for the test is the sum of the probabilities of the observed table and all tables more extreme than it, given the fixed margins" (Madadizadeh et al., 2026, p. 204). For a 2 x 2 table with cells a, b, c and d, the probability of one arrangement is the product of the four factorial totals divided by N! and the factorials of the four cells.
Nothing is estimated, which is the main difference from chi-square. Every possible table with your margins is listed, each gets an exact probability, and the p-value is a sum of those probabilities. That also explains why the p-value moves in small steps for small tables, a feature that becomes important in the next section.
◆ Question 4 / 7 · Worked example
A worked example where the two tests disagree
Direct answer: This invented illustration uses 12 students, with 6 taught by each of two methods. Method A had 5 passes and 1 fail, and Method B had 1 pass and 5 fails. Every expected count is 3, so the 20% guideline fails. Pearson chi-square gives p = .021, but Fisher's exact test gives p = .080.
The counts below are made up to show the mechanics, not taken from a real study.
| Pass | Fail | Total | |
|---|---|---|---|
| Method A | 5 | 1 | 6 |
| Method B | 1 | 5 | 6 |
| Total | 6 | 6 | 12 |
Each expected count equals row total times column total divided by N, so 6 x 6 / 12 = 3 in all four cells. That is 100% of cells below 5, far beyond the 20% limit, so chi-square is not trustworthy here. Fixing the margins, the number of passes in Method A can only be 0 to 6, with probabilities 1, 36, 225, 400, 225, 36 and 1 out of 924. The observed table has probability 36/924 = .039, and the two-sided p-value adds every table at least that unlikely, giving (1 + 36 + 36 + 1)/924 = 74/924 = .080.
Pearson chi-square gives chi-square(1) = 5.33, p = .021, which would be called significant at .05. Yates' continuity correction, which SPSS prints for 2 x 2 tables (IBM, n.d.), lowers the statistic to 3.00 and gives p = .083. The approximate test and the exact test therefore lead to different conclusions on the same 12 students, which is exactly the situation the guideline is designed to catch.
◆ Question 5 / 7 · Too conservative?
Is Fisher's exact test too conservative?
Direct answer: Fisher's exact test can be conservative. Because the table is discrete, the exact p-value tends to be larger than an approximate one, so the test rejects the null hypothesis a little less often than its nominal level. Alternatives such as the mid-p value exist for certain research contexts (Madadizadeh et al., 2026).
The tutorial says that "a recognized characteristic of this conditional approach is that it can be conservative, leading to discussions about alternative methods like the mid-p-value in certain research contexts" (Madadizadeh et al., 2026, p. 204). Its comparison table likewise notes that Fisher's p-values tend to be larger because of the discrete distribution (Madadizadeh et al., 2026, p. 203). In the example above, the exact result of .080 sits well above the chi-square result of .021, which shows the direction of the difference.
For a student project the practical advice is simple. When expected counts are small, report Fisher's exact test, accept that the test is cautious, and say so if your result is borderline. Yates' continuity correction (IBM, n.d.) makes chi-square behave better with small numbers, but it only adjusts the approximation. It does not turn chi-square into an exact test, so it does not replace Fisher when the expected counts fail the guideline.
◆ Question 6 / 7 · In SPSS
How do you run Fisher's exact test in SPSS?
Direct answer: Go to Analyze > Descriptive Statistics > Crosstabs, place one variable in Rows and one in Columns, tick Chi-square under Statistics, and tick Expected under Cells. For a 2 x 2 table SPSS computes Fisher's exact test when any expected count is below 5 (IBM, n.d.). For larger tables, click Exact... and choose Exact (Madadizadeh et al., 2026).
For 2 x 2 tables, IBM (n.d.) states that "Fisher's exact test is computed when a table that does not result from missing rows or columns in a larger table has a cell with an expected frequency of less than 5." The Chi-square option also provides the Pearson, likelihood-ratio and Yates' corrected statistics (IBM, n.d.). For larger tables, the tutorial describes the route in section 6.1: in Analyze > Descriptive Statistics > Crosstabs, "Place variables in Row/Column, click Exact..., and select 'Exact' to get Fisher's test result" (Madadizadeh et al., 2026, p. 207). The same dialog has a Monte Carlo option, which the authors describe as a practical alternative for very large tables (Madadizadeh et al., 2026, pp. 206-207). The Exact... button needs the Exact Tests option, which some licences may not include, so check with your university if the button is missing.
For tables larger than 2 x 2, the generalisation is the Fisher-Freeman-Halton test, so a 3 x 3 crosstab with sparse cells is reported under that name (Madadizadeh et al., 2026, pp. 206-207). Read the footnote under the Chi-Square Tests table, which states how many cells have an expected count below 5, and use it to confirm whether chi-square was ever an option. If you want a second pair of eyes on your output, our SPSS, R and Python help offers expert guidance while you run and write up the analysis yourself.
◆ Question 7 / 7 · APA reporting
How do you report Fisher's exact test in APA style?
Direct answer: Name the test, give the exact p-value rather than "p < .05", and add an effect size such as an odds ratio with its confidence interval. The tutorial's example reads "Fisher's exact test, p = 0.032" (Madadizadeh et al., 2026, p. 203), and in APA style you would drop the leading zero.
The tutorial's checklist asks authors to "state 'Fisher's exact test' and report the exact p-value (e.g., p = 0.015), not 'p < 0.05'" (Madadizadeh et al., 2026, pp. 207-208). It also suggests considering an odds ratio with a confidence interval, because a p-value alone does not tell the reader how large the association is. The tutorial's own reported value, p = 0.032 (Madadizadeh et al., 2026, p. 203), becomes p = .032 in APA style, and a threshold statement such as p < .05 is not a substitute for it.
For the illustration above, a sentence in a results section could read: "A Fisher's exact test showed no significant association between teaching method and pass rate, p = .080, although 5 of 6 students passed under Method A compared with 1 of 6 under Method B." Add one line in your methods chapter explaining that Fisher's test was chosen because all expected counts were below 5. That sentence is what shows a marker that the choice was deliberate, not accidental. The example sentence leaves out an odds ratio on purpose. The sample odds ratio is 25 (5 x 5 divided by 1 x 1), but with cells this small a single student moves it enormously, so it would mislead more than it informs. With your own larger counts, include it with its interval. The example numbers are invented, so use your own.
Frequently asked questions
Is Fisher's exact test only for 2 x 2 tables?
No. The generalisation to larger tables is the Fisher-Freeman-Halton test, and SPSS offers a Monte Carlo approximation as a practical alternative for very large tables (Madadizadeh et al., 2026, pp. 206-207).
Is Fisher's exact test only for small samples?
No. Kim (2017) notes that it is practically applied only to small samples but is valid for all sample sizes. Madadizadeh et al. (2026) add that it is generally unnecessary in large samples, because the two tests converge as counts grow.
Should I look at observed or expected counts when choosing the test?
Expected counts. Grace-Martin (n.d.) stresses that the assumption concerns the expected value in each cell, so request expected counts in the Cells dialog and compare them with the 5 threshold.
What is the 20% rule for chi-square?
Chi-square results are relevant only when no more than 20% of cells have expected frequencies below 5 (Kim, 2017). Many university guides also add that no expected count should fall below 1.
Does the Yates correction fix chi-square for small samples?
It reduces the problem but does not remove it. SPSS prints Yates' corrected chi-square for 2 x 2 tables (IBM, n.d.), and in our 12-student example it moves p from .021 to .083, while the exact value is .080.
Do I report a one-sided or two-sided p-value?
Report the two-sided value unless your hypothesis stated a direction before you collected data. The worked example above used the two-sided calculation, which sums every table at least as unlikely as the observed one.
References
Grace-Martin, K. (n.d.). Observed values less than 5 in a chi-square test? No biggie. The Analysis Factor. https://www.theanalysisfactor.com/observed-values-less-than-5-in-a-chi-square-test-no-biggie/
IBM. (n.d.). Crosstabs statistics. IBM SPSS Statistics 31.0.0 documentation. https://www.ibm.com/docs/en/spss-statistics/31.0.0?topic=crosstabs-statistics
Kim, H.-Y. (2017). Statistical notes for clinical researchers: Chi-squared test and Fisher's exact test. Restorative Dentistry & Endodontics, 42(2), 152–155. https://doi.org/10.5395/rde.2017.42.2.152
Madadizadeh, F., Taheri Soodejani, M., & Bahariniya, S. (2026). An educational tutorial on Fisher's exact test for medical researchers. Journal of Reliability and Statistical Studies, 19(1), 199–214. https://doi.org/10.13052/jrss0974-8024.1919
Neuhäuser, M., & Ruxton, G. D. (2025). The choice between Pearson's χ2 test and Fisher's exact test for 2 × 2 tables. Pharmaceutical Statistics, 24(3), Article e70012. https://doi.org/10.1002/pst.70012
Tools & resources
Not sure how this guide applies to your own case? Talk it through with MAAS in a free 20-minute consultation.
Book a free consultation ▸