
◆ Accounting & Finance
ACCT503: why is half the mark on an exam you cannot click through?
ACCT503 is a paper you learn by doing: you build a database, run analytics on real data, and draw flowcharts. Yet half of the final grade arrives as a written exam, where none of that software sits in front of you, and the skill being tested is whether you can reason about a system on paper alone. Students who only practise in the software are preparing for just one half of the mark.
◆ Section 1 / 7 · Which ACCT503
First, confirm which ACCT503 you are enrolled in
Direct answer: This guide describes the Auckland University of Technology paper ACCT503 Accounting Systems and Analytics, a 15-point Level 5 paper with no prerequisite and ACCT502 as a corequisite. Codes beginning ACCT5 are used differently at other institutions, so check that the paper you are looking at names AUT.
Evidence: The AUT paper descriptor lists 150 total learning hours, no prerequisites and no restrictions, with ACCT502 required alongside. The corequisite matters: the university expects the two papers to be taken together, which means the systems paper assumes you are building financial accounting fluency at the same time rather than beforehand.
Example: A student who deferred ACCT502 to the following semester found the revenue-cycle examples harder than her classmates did, not because the systems content was difficult but because the underlying transactions were still unfamiliar. The paper is designed on the assumption that both streams run together.
◆ Section 2 / 7 · What it asks
What is the paper actually asking of you?
Direct answer: Four learning outcomes, and they escalate. You discuss the purpose and importance of accounting information systems and document system processes using appropriate tools, you apply relational database concepts and basic SQL queries to retrieve accounting data, you use data analytics and visualisation to support decision-making, and you analyse internal control principles and risks within those systems.
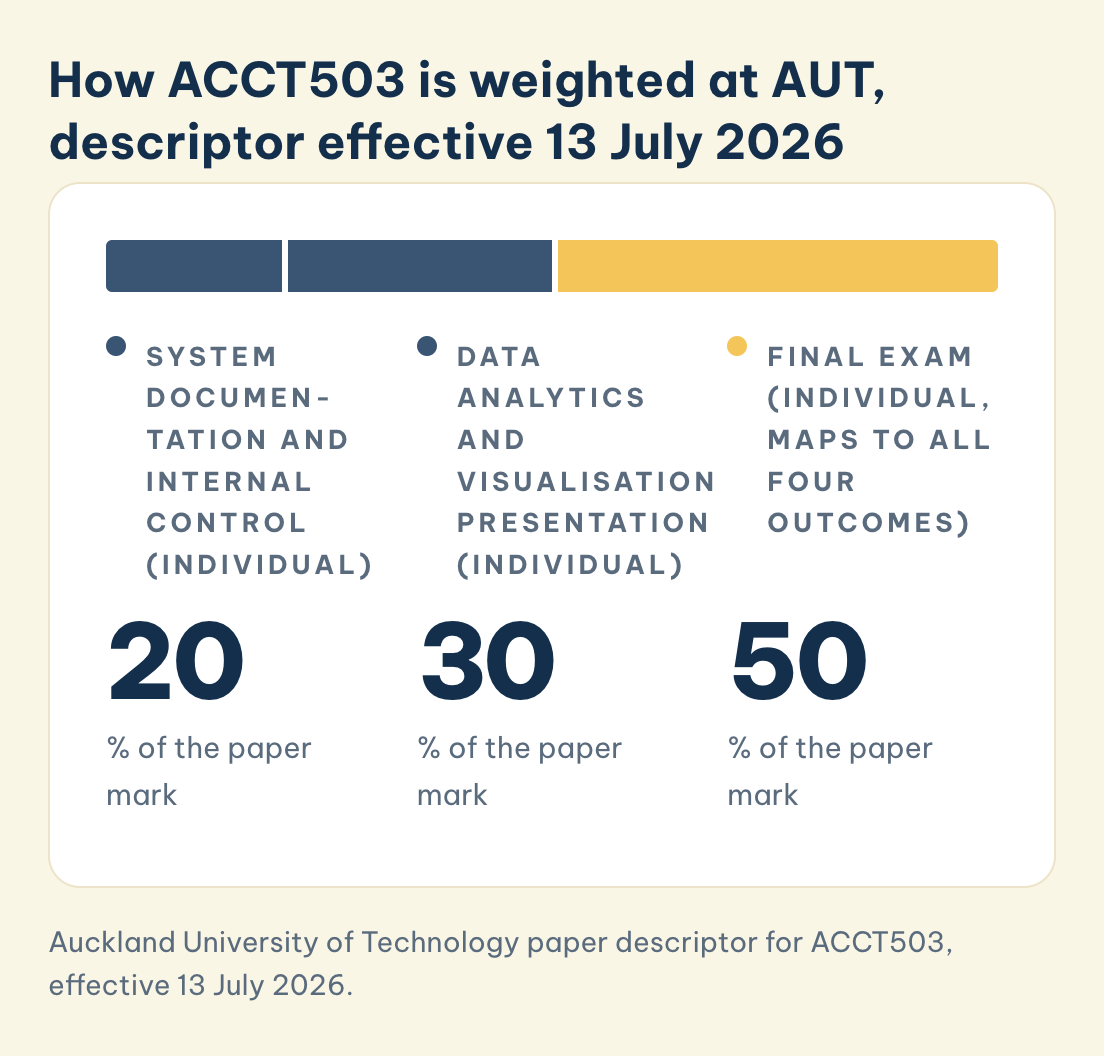
How ACCT503 is weighted at AUT, descriptor effective 13 July 2026
The yellow part is the final exam, which maps to all four learning outcomes. The navy parts are the two other individual assessments.
System documentation and internal control (individual)
20
% of the paper mark
Data analytics and visualisation presentation (individual)
30
% of the paper mark
Final exam (individual, maps to all four outcomes)
50
% of the paper mark
Save this figure
Evidence: The descriptor's content list, checked on 19 August 2026 against the version effective 13 July 2026, is Importance of AIS, System Development, System documentation, Databases, Data Analytics and Control of AIS. Control is 1 strand among the 6 rather than the organising theme, but it is not a footnote either: it carries its own learning outcome and it is named in the title of the first assessment. The relational-database content this paper teaches traces back to Codd (1970), A Relational Model of Data for Large Shared Data Banks, published in Communications of the ACM volume 13, issue 6, pages 377 to 387, which opens with the stated problem it was solving: "Future users of large data banks must be protected from having to know how the data is organized in the machine" (Codd, 1970, p. 377). The idea that data should sit in independent tables linked by keys, queried through a language rather than pulled through fixed pointers, is what SQL was built to implement. IBM researchers Donald D. Chamberlin and Raymond F. Boyce built that query language directly on Codd's model in the early 1970s, and it became an ANSI standard in 1986 and an ISO standard in 1987, so the syntax you practise in this paper's labs is itself a 50-plus year old, internationally standardised piece of engineering rather than a course-specific tool.
Example: A student who had read ahead using an American AIS textbook arrived prepared to write mainly about control frameworks and segregation of duties. That material was relevant and it was assessed, but it was one half of a first assessment that also demanded system documentation, in a paper whose remaining weight sits in analytics and in a written exam.
| Assessment | Weight | Outcomes it maps to | Where students lose marks |
|---|---|---|---|
| System documentation and internal control, individual | 20% | 1 and 4 | Drawing the process that should exist rather than the one the narrative describes |
| Data analytics and visualisation presentation, individual | 30% | 2 and 3 | Presenting output without naming the decision it supports |
| Final exam, individual | 50% | All four | Practising only in the tools and never in sentences |
All three assessments are individual. There is no group-assessed component and no separately weighted quiz in the descriptor effective 13 July 2026, so treat any study plan built around those, including advice from an earlier cohort, as out of date until you check your own Canvas page.
◆ Section 3 / 7 · Exam weighting
Why does the exam weighting change how you should study?
Direct answer: Because 50% on a closed exam, in a paper whose skills are practical, means the examinable version of each skill is the explanation of it rather than the performance of it. You can be genuinely competent in the database software and still lose marks if you cannot say in writing why a table was normalised the way it was.
Evidence: The four assessed learning outcomes are all tested by the final exam, according to the descriptor's mapping, whereas each individual assignment maps to only one or two. The exam is the only assessment that requires you to hold the whole paper at once.
Example: A student who could build a working database in the lab was asked in a past exam question to explain what would break if two entities were merged into one table. She knew the answer in her hands and could not put it in sentences, which is a common and fixable gap. Two weeks of writing short explanations of things she could already do closed it.
A practical habit is to finish every lab session by writing three sentences: what you built, what decision the structure encoded, and what would go wrong under a different choice. That is the exam version of the same work.
◆ Section 4 / 7 · Flowchart test
What does the flowchart test actually reward?
Direct answer: Fidelity, not tidiness. The test asks you to document the operation of an accounting system, and the mark comes from whether your diagram matches the process as described, including its awkward parts, rather than whether it looks clean.
Evidence: The learning outcome is to document the operation of accounting systems, which is a descriptive obligation before it is an evaluative one. Students often improve the process while drawing it, silently removing a manual step or an approval that the narrative actually contains.
Example: Given a narrative in which an invoice is approved twice, once by a supervisor and again by accounts payable, a student drew a single approval because the duplication looked like an error. It was not an error in the question. The redundancy was the point, and the mark was for showing it.
The double approval in that example is a textbook control activity, one of the 5 components in the COSO Internal Control, Integrated Framework, first published in 1992 by the Committee of Sponsoring Organizations of the Treadway Commission and updated in 2013. Alongside control activities the framework names control environment, risk assessment, information and communication, and monitoring, and a flowchart that shows where a control activity sits in a process is doing exactly the descriptive job the learning outcome asks for.
◆ Section 5 / 7 · Presentation
Why is the presentation worth more than the documentation task?
Direct answer: Because the analytics component at 30% is where the paper's two hardest outcomes sit together, and translating data into something a reader can act on is a slower skill to acquire than drawing a process accurately.
Evidence: The descriptor maps the presentation to outcomes 2 and 3, which are the relational-database and the analytics-and-visualisation outcomes. That pairing is the reason it carries more weight than the 20% documentation task: it asks you to retrieve the data and then to make it mean something, whereas documentation asks you to represent faithfully what already exists.
Example: A student allocated her time by how academic each task looked, spending most of it on the documentation piece because flowcharts felt like the examinable skill. The presentation, worth half again as much, was assembled in two evenings. Effort followed familiarity rather than weighting, which is the most common and most avoidable way to lose marks in a paper structured like this.
◆ Section 6 / 7 · Analytics
The analytics half, and the disagreement behind it
Direct answer: The analytics assignment asks you to present financial and non-financial data to facilitate decision-making, and the operative word is facilitate. Output that does not change or support a decision has not met the outcome, however competent the technique.
Evidence: That disagreement is a live question in accounting education rather than a settled one. Dzuranin, Jones and Olvera (2018), pages 24 to 39, surveyed faculty and found that developing an analytic mindset was rated more important than tool-specific skill, and that respondents favoured placing analytics in upper-level coursework. Sledgianowski, Gomaa and Tan (2017), pages 81 to 93, argue for integrating data and technology competencies across the curriculum rather than isolating them. AUT places this material at Level 5, which is early by the first view and consistent with the second.
Example: Two submissions used the same dataset and the same technique. The weaker one produced four visualisations and described what each showed. The stronger one produced two, and stated which management decision each would change and under what threshold. The second student did less work in the software and more in the thinking, and that is the distribution the outcome rewards.
◆ Section 7 / 7 · Six things to do
Six things worth doing in this paper
- Take ACCT502 alongside it as the descriptor intends, and if you cannot, expect to spend extra time on the underlying transactions.
- Read the assessment plan on your own Canvas page in week one and check it against the descriptor. Course descriptors may be amended between teaching periods, and the descriptor itself says so.
- Practise documenting a system from a written narrative, because the first assessment pairs that skill with internal control rather than testing it alone.
- Document what you built, not what you would have built. Fidelity first, improvement only if the question asks for it.
- Build the relational model and the analytics on the same dataset where you can, since outcomes 2 and 3 are assessed together in one task.
- For every analytics output, write the decision it supports. If you cannot name one, the visualisation is not finished.
Frequently asked questions
Do I need programming experience for ACCT503?
The descriptor lists no prerequisites and no restrictions. The paper introduces database software and analytics techniques rather than assuming them, though students without prior exposure should expect the lab work to take longer in the first few weeks.
What is the corequisite and can I skip it?
ACCT502 is the corequisite, meaning it is intended to run alongside rather than before. Enrolment rules are set by the faculty, so if your plan requires separating them, raise it with your programme adviser rather than assuming it is permitted.
How much of the grade is group work?
None of it, in the descriptor effective 13 July 2026. All three assessments are marked individually, and the final exam alone carries 50%.
How should I revise for a practical paper's written exam?
By explaining in writing the things you can already do in the software. The exam maps to all four learning outcomes, so it is testing whether you can reason across the paper rather than operate any single tool.
Is this the same as an auditing or internal controls paper?
Not primarily. Control of AIS is one of six content strands and it carries its own outcome, but the weight sits with documentation, databases and analytics. Treat control frameworks as one topic among several rather than as the organising theme.
Where MAAS fits
MAAS mentors work alongside students in papers like this rather than in place of them. Where a paper teaches through practice and then examines through writing, the useful thing a mentor does is close the gap between the two: asking you to explain a design you have already built, until the explanation is as fluent as the build. The work stays yours. If that is useful, our academic support service and our tutoring service are the two places to start.
References
Codd, E. F. (1970). A relational model of data for large shared data banks. Communications of the ACM, 13(6), 377–387. https://doi.org/10.1145/362384.362685
Dzuranin, A. C., Jones, J. R., & Olvera, R. M. (2018). Infusing data analytics into the accounting curriculum: A framework and insights from faculty. Journal of Accounting Education, 43, 24–39. https://doi.org/10.1016/j.jaccedu.2018.03.004
Sledgianowski, D., Gomaa, M., & Tan, C. (2017). Toward integration of Big Data, technology and information systems competencies into the accounting curriculum. Journal of Accounting Education, 38, 81–93. https://doi.org/10.1016/j.jaccedu.2016.12.008
Tools & resources
Auckland University of Technology. (n.d.). ACCT503 Accounting Systems and Analytics paper descriptor (descriptor start date 13 July 2026). Retrieved August 19, 2026, from https://paperdescriptorreport.aut.ac.nz/PaperDescriptor/PaperDescriptor?courseCode=ACCT503
A free 20-minute consultation is a conversation about where you are with ACCT503.
Book a free consultation ▸